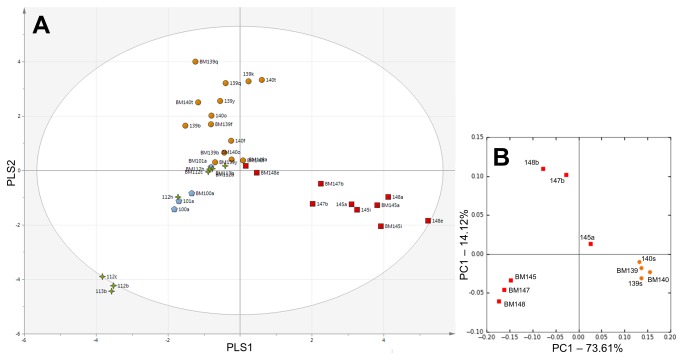
Figure 2. Comparison of breast milk with respective stool profiles.
Subjects are symbolised based on related multiples. a) Partial least squares discriminant analysis (PLS-DA) based on DGGE data of all breast milk (EBM) samples matched to respective stools. The ellipse indicates Hotellings T 2 range, at 95% confidence. b) Weighted UniFrac PCoA based on pyrosequencing data at genus level, generated from a subset of EBM and respective stool samples.

