
Figure 4. Comparative distribution and quantitation of proteins and polyphenols in protein-polyphenol complexes,
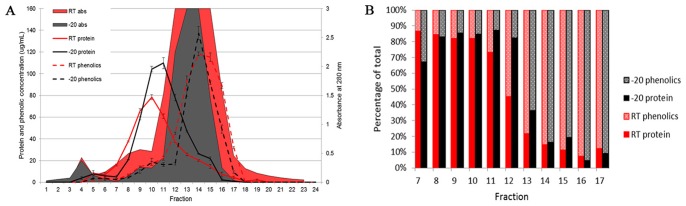
A SEC profile (at A 280 nm) of the size distribution of protein-polyphenol complexes in buckwheat honey (H177) stored at −20°C (black line) and at room temperature (red line), and the distribution of proteins (as estimated by Bradford method, black line, −20°C, red line, RT) and polyphenols (as estimated by Folin-Ciocalteu method, black dotted line, −20°C and red dotted line, RT) (A). The protein to polyphenol ratio in fractions expressed as percentage of the total mass (B).