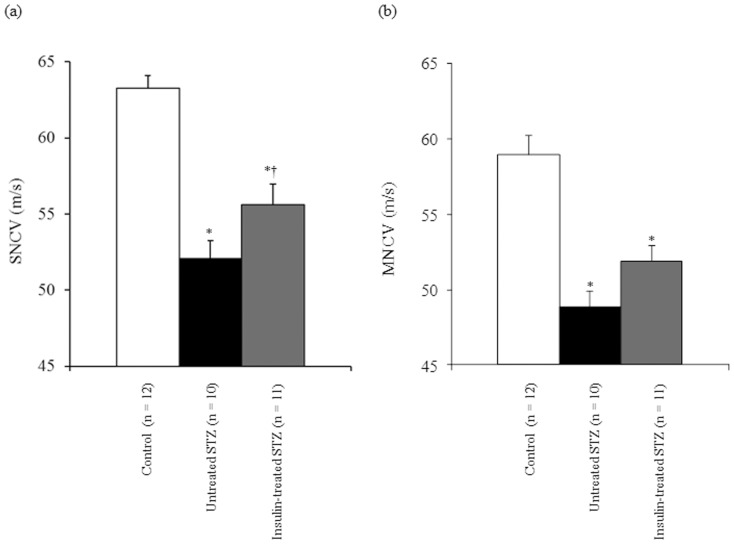
Figure 2. Sensory (SNCV) (a) and motor nerve conduction velocity (MNCV) (b) in left sciatic-tibial nerves of control (white bars), untreated STZ-induced diabetic (black bars), and insulin-treated STZ-induced diabetic (grey bars) rats.
Data are means ± SE. * p<0.0001 vs. control rats; † p<0.05 vs. untreated STZ-induced diabetic rats.

