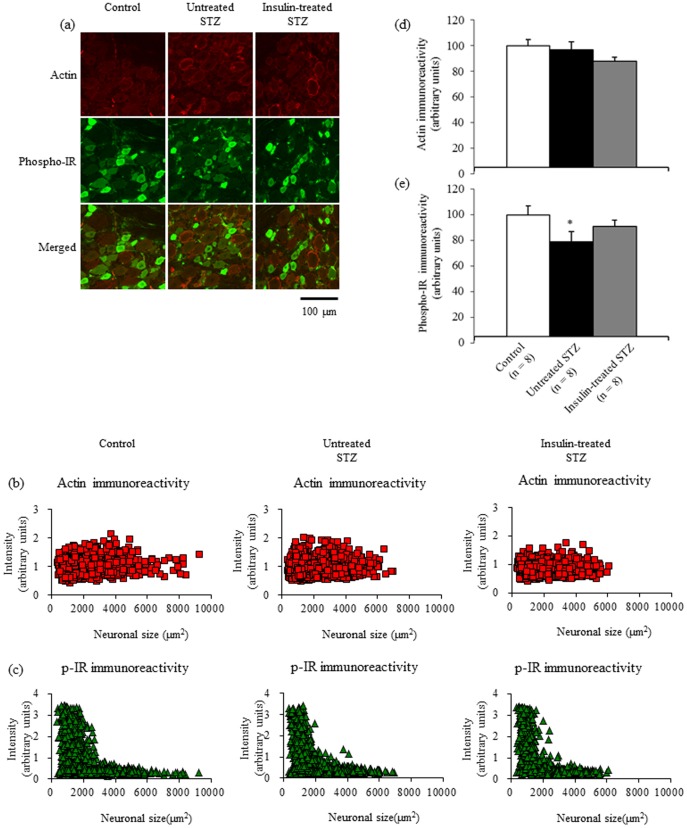
Figure 5. Double immunofluorescent labelling for actin and phosphorylated insulin receptor (a) from lumbar DRGs of control, untreated STZ-induced diabetic, and insulin-treated STZ-induced diabetic rats.
Intensities of actin (b) and phosphorylated insulin receptor fluorescence (c) are displayed as a scatter plot against neuronal area. The mean pixel intensity of actin fluorescence in sensory neurons and satellite cells (d) does not differ among the three groups, whereas neuronal and satellite cell phosphorylated insulin receptor fluorescence intensity (e) is significantly decreased, by 21%, in untreated STZ-induced diabetic rats (black bars) and unchanged in insulin-treated STZ-induced diabetic rats (grey bars), compared with control rats (white bars). Data are means ± SE. Bar = 100 µm. * p<0.05 vs. control rats. DRG: dorsal root ganglion; IR: insulin receptor.

