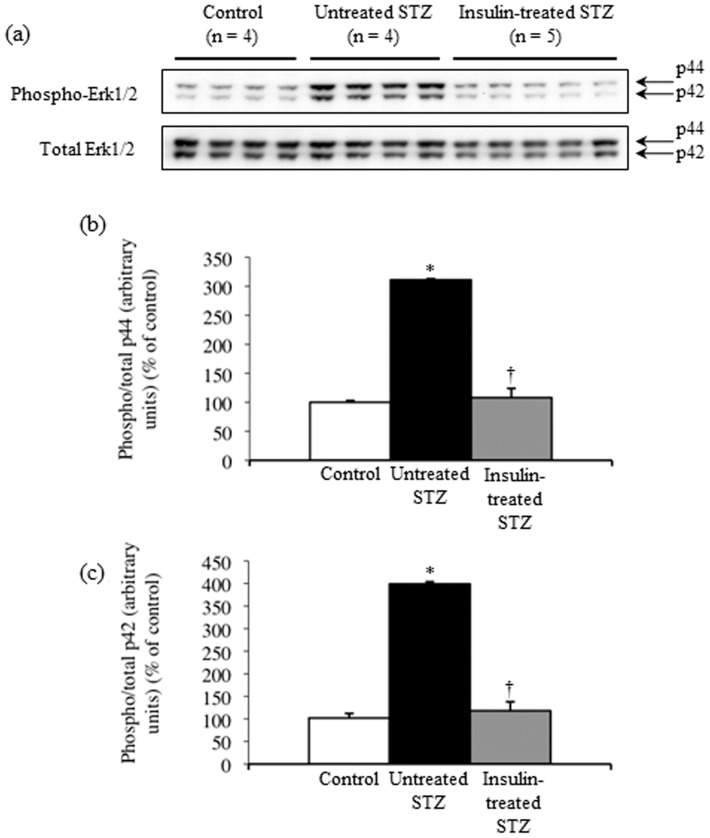
Figure 9. Representative blots show levels of sciatic nerve p44/42 MAPK total proteins and their phosphorylation in control (n = 4), untreated STZ-induced diabetic (n = 4), and insulin-treated STZ-induced diabetic (n = 5) rats (a).
Proteins extracted from the sciatic nerve of one rat were immunoblotted with antibodies that recognized total p44/42 MAPK or phosphorylated p44/42 MAPK. Western blot signals for phosphorylated p44 (b) and p42 (c) were normalized to their total protein levels. Values are means ± SE. White, black, and grey columns: control (n = 4), untreated STZ-induced diabetic (n = 4), and insulin-treated STZ-induced diabetic (n = 5) rats, respectively. * p<0.0001 vs. control; † p<0.0001 vs. untreated STZ-induced diabetic rats.

