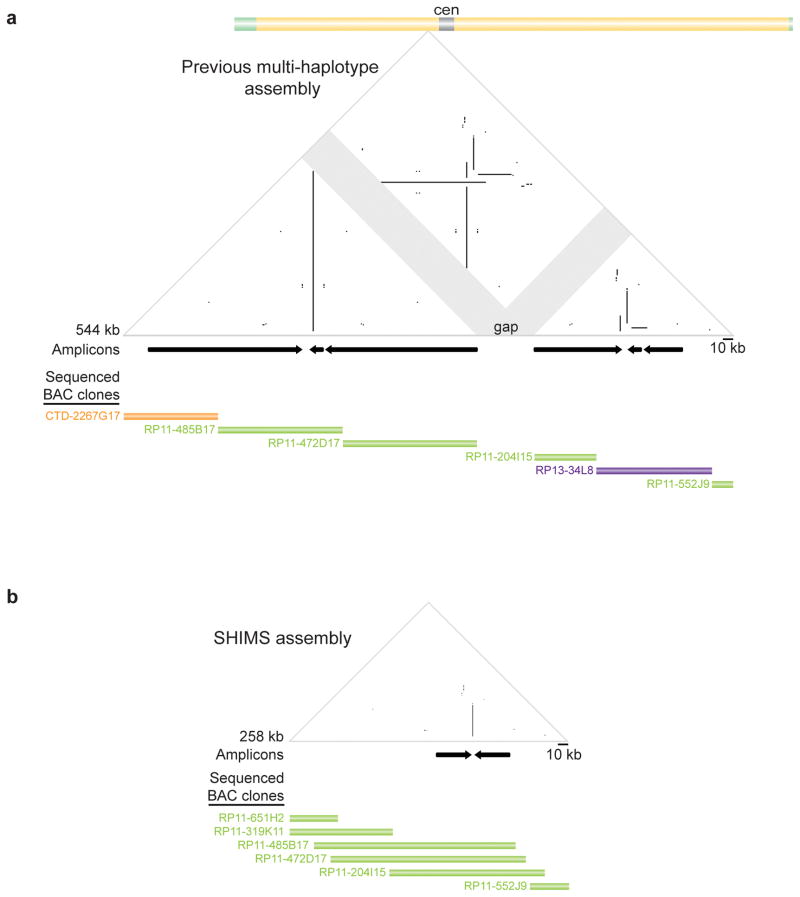
Figure 2. Comparison of mosaic and SHIMS sequence assemblies across one region of human X chromosome.
a, Triangular dot-plot highlights sequence similarities within mosaic (multi-haplotype) assembly. Each dot represents 100% identity within a window of 100 nucleotides; direct repeats appear as horizontal lines, inverted repeats as vertical lines, and palindromes as vertical lines that nearly intersect the baseline; gaps are indicated by gray shading. Black arrows immediately below plots denote positions and orientations of amplicons. Further below, sequenced BACs from CTD, RP-11, and RP-13 libraries (each from a different individual) contributing to the assembly are depicted as orange, green, and purple bars, respectively; each bar reflects extent and position within assembly of finished sequence for that BAC. (As per the human genome assembly standard, finished-sequence overlaps between adjoining BACs are limited to 2 kb.) GenBank accession numbers in Supplementary Table 1. b, SHIMS assembly of same region. All BACs derive from RP-11 library (one male) and are fully sequenced; each BAC’s finished sequence extensively overlaps those of adjoining BACs.

