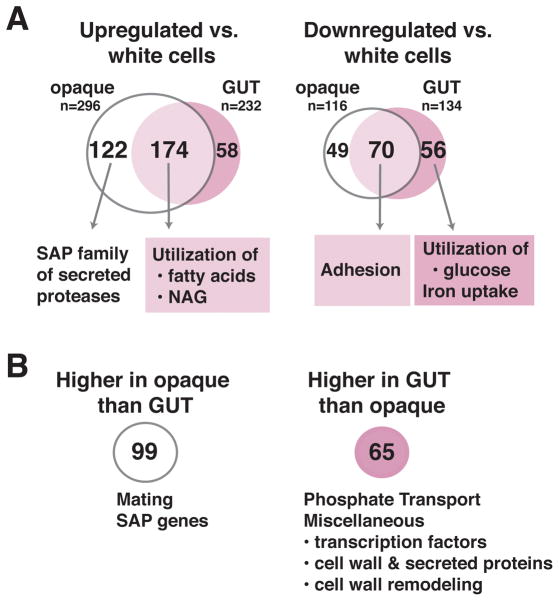
Figure 4. GUT and opaque cells exhibit overlapping but distinct patterns of transcriptional expression.
RNAs from WOR1OE MTLa/α GUT cells (SN1045, n = 4 biological replicates), MTLa opaque cells (SN967, n = 2 biological replicates), and isogenic white controls (n = 2–4 biological replicates) were profiled using custom Agilent C. albicans ORF microarrays and a pooled reference. Significant changes in gene expression were defined as ones with BAGEL p-values <0.05, after implementation of a Bonferroni correction for comparison of multiple variables. A) Venn diagram of genes that are significantly upregulated or downregulated in both opaque and GUT cells, relative to white cells. B) Genes that are differentially expressed by GUT vs. opaque cells.

