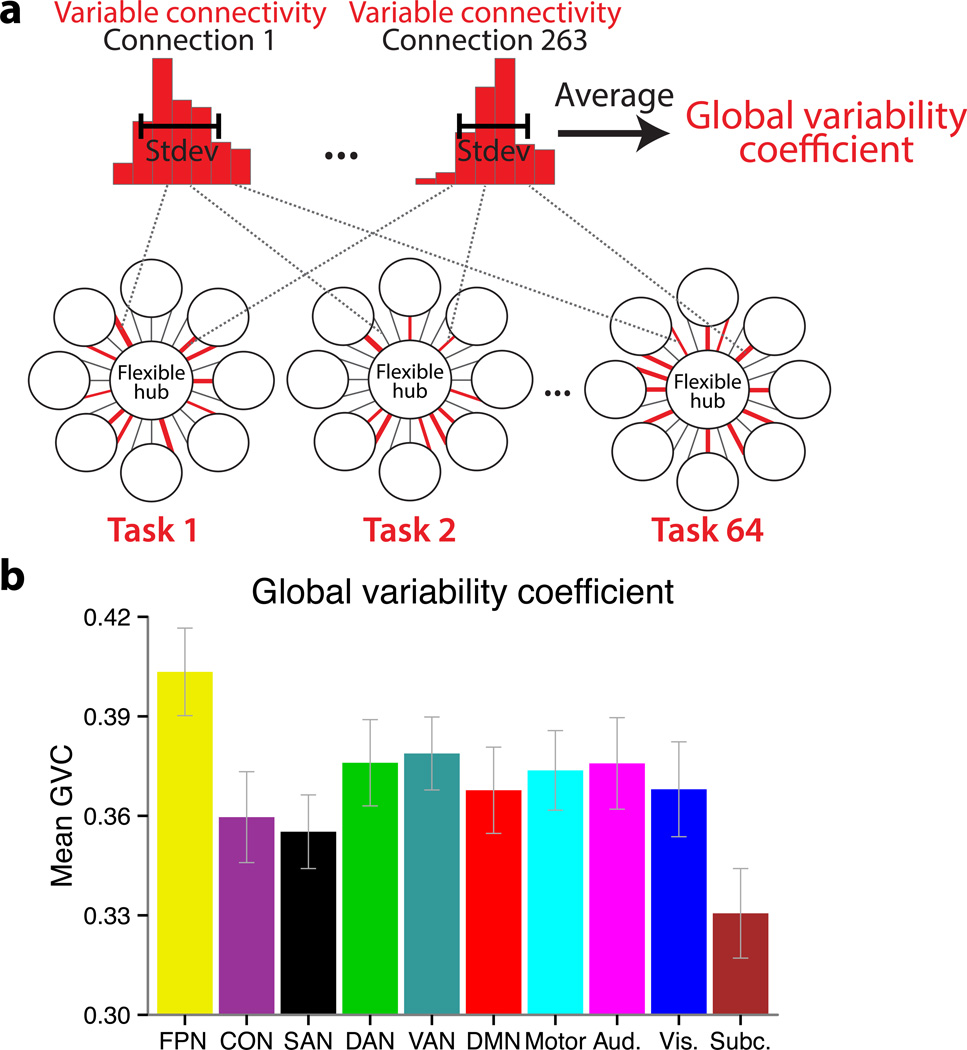
Figure 4.
Global variability coefficient (GVC) – a measure of global variable connectivity – is highest for the FPN. (a) We developed a measure to identify the highly global and flexible functional connectivity predicted by the flexible hub theory. A distribution of functional connection strengths across 64 task states was estimated for each region-to-region connection, and the variability (standard deviation) was then averaged across all of a given region’s connections. The distributions of an FPN region’s (LPFC region in Supplementary Fig. 1; Talairach coords: −45, 7, 24) connectivity with a visual network region (left) and a motor network region (right) for a single subject are shown as representative examples. The histograms summarize the spread of the 64 functional connectivity estimates in terms of connection strength (x-axis = 7 bins of connection strength, y-axis = count of task states with a given connection strength). (b) Each network’s GVC (mean of each network’s regions’ variable connectivity with all 264 regions). The error bars illustrate the inter-subject standard errors. The FPN had significantly (p<.05, FDR corrected) higher GVC than all other networks. Code for computing GVC is available at http://www.mwcole.net/cole-etal-2013/.

