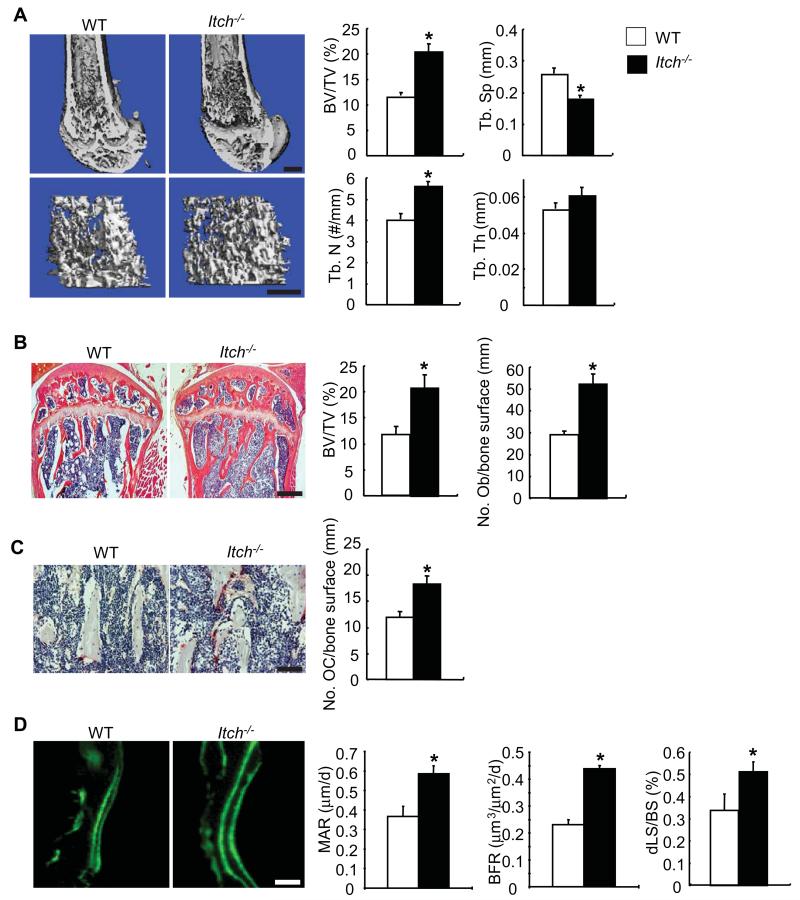
Figure 1. Itch−/− mice have increased bone volume.
Bones from 1-month-old Itch−/− mice and WT littermates were analyzed. (A) Representative image of μCT scanning of femur and μCT data analyses. Bar = 300μm. (B) H&E-stained tibial sections and histomorphometric analyses of the percentage of BV/TV and the number of osteoblast (Ob)/mm bone surface. Bar = 250μm. (C) TRAP-stained sections and the number of TRAP+ osteoclasts (OC)/mm bone surface. Bar = 50μm. (D) Double calcein labeling of femoral sections and bone formation parameters. Bar = 25μm. Values are mean ± SD of 5 mice/group. *p<0.05 vs WT mice.

