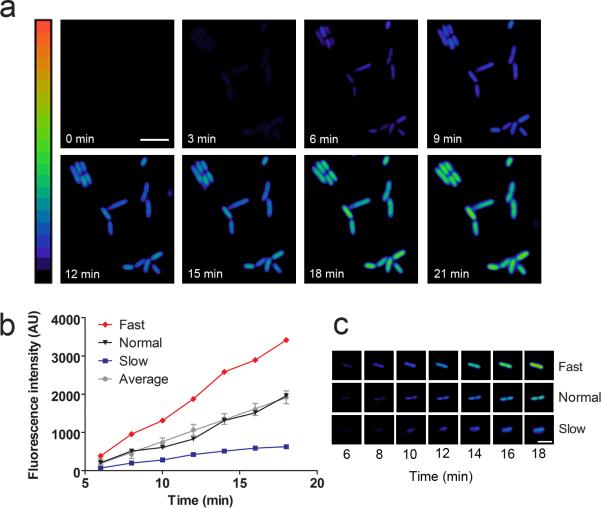
Figure 2. Visualization of MCP synthesis in individual cells after MS2 phage infection.
(a) Kinetics of MCP synthesis after viral infection. E. coli expressing the MCP sensor were infected with MS2 phage at an MOI of 10. MCP synthesis was monitored as an increase in fluorescence signal over time. Images are pseudocolored to show the fold increase in fluorescence at each time point following infection of MS2 phage. Color scale bar represents 0- to 20-fold changes in fluorescence signal. Scale bar, 5 μm.
(b) MCP synthesis kinetics vary in individual cells. E. coli were infected at an MOI of 0.1 and fluorescence was monitored over time. One hundred cells were quantified and an average rate of fluorescence increase was calculated. The average values and SEM are shown (gray line). Based on this average rate, cells were either categorized as Fast (red line), Normal (black line), or Slow (blue line).
(c) Representative examples of Fast and Slow cells. Fast and Slow cells accumulated MCP with a rate greater or less than two standard deviations from the mean rate, respectively. Time points following application of MS2 phage are indicated.
(d) Percentage of cells in fast, average, and low categories for MCP synthesis. The rate of fluorescence increase in 85% of cells was within two standard deviations of the mean value (gray), whereas 4% of cells were faster than average (red), and 11% of cells were slower than average (blue).

