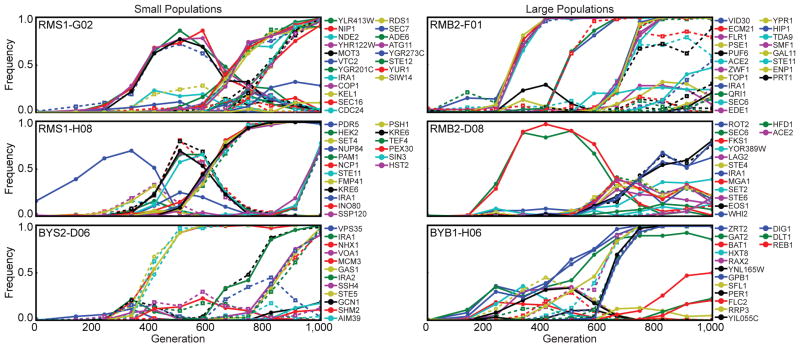
Figure 1. The fates of individual spontaneously arising mutations.
We show the frequency of all identified mutations through 1,000 generations in 6 of the 40 sequenced populations. Nonsynonymous mutations are solid lines with solid circles, while synonymous and intergenic mutations are dotted lines with open circles and squares respectively. Populations in the left and right columns were evolved at small (105) and large (106) population sizes, respectively. We observe qualitatively similar patterns in the other populations (Supplementary Fig. 1).

