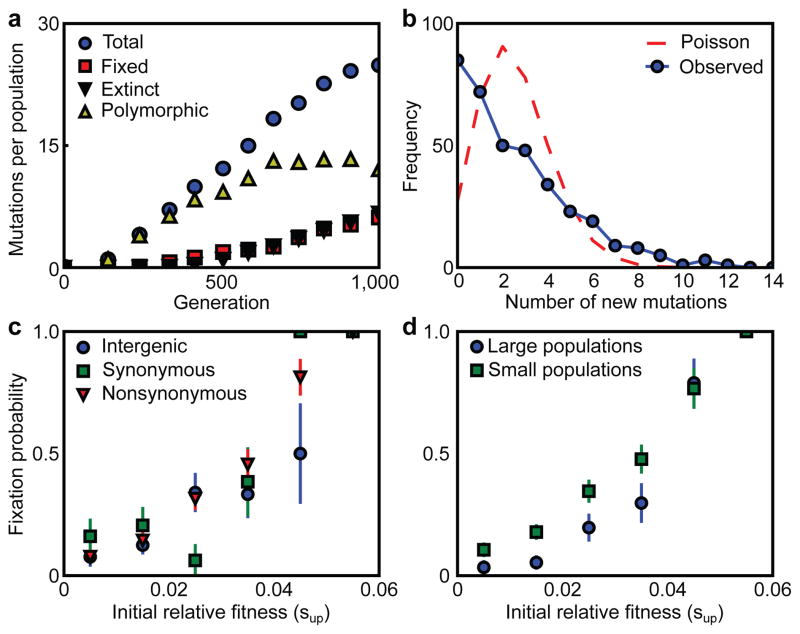
Figure 2. Statistical analysis across 40 replicate populations.
a, The per-population number of total mutations, fixed mutations, extinct mutations, and mutations that are currently polymorphic over the course of the 1,000 generations. b, The distribution of the number of new mutations detected at each timepoint (solid blue line; see Methods for details) and a Poisson distribution with the same mean (dashed red line). c–d, Mutation fixation probability as a function of initial relative fitness. Data are mean±s.e.m.

