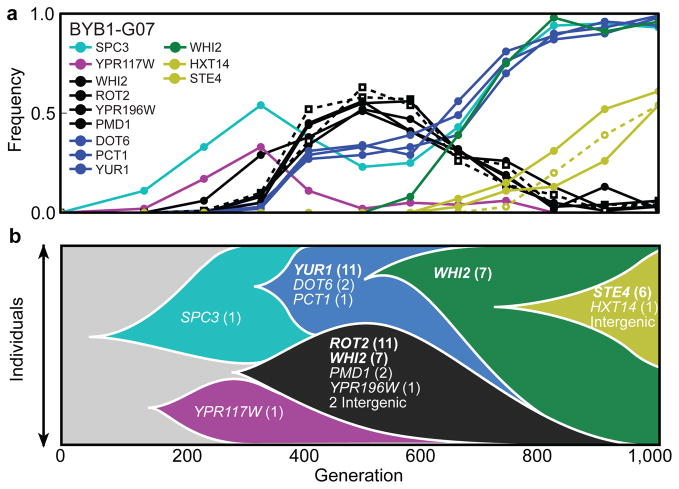
Figure 3. The dynamics of sequence evolution in BYB1-G07.
a, The trajectories of the 15 mutations that attain a frequency of at least 30%, hierarchically clustered into several distinct mutation “cohorts,” each of which is represented by a different color (Methods). b, Muller diagram showing the dynamics of the six main cohorts in the population. The number of times a mutation was observed in a given gene across all 40 populations is indicated in parentheses. Mutations in genes observed in more than three replicate populations (Table 1) are indicated in bold.

