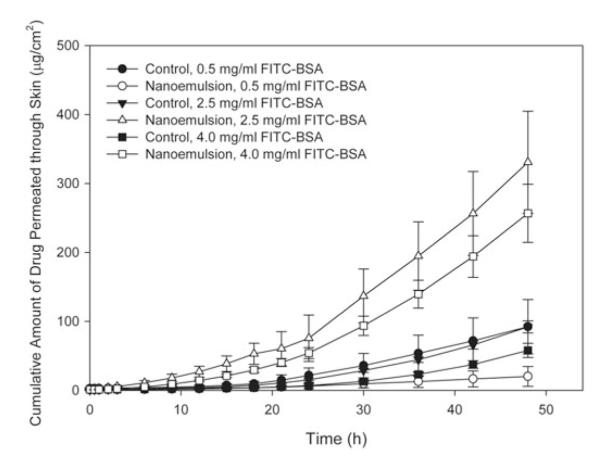
Figure 4.
Permeation profile of FITC-BSA through mouse skin from nanoemulsions (formulation B2) containing different concentrations of FITC-BSA and their corresponding control solutions containing FITC-BSA. Data represent mean ± SEM. Statistically significant differences in steady-state flux (p<0.05): 0.5 mg/mL nanoemulsion versus 2.5 mg/mL nanoemulsion and 4.0 nanoemulsion, 2.5 mg/mL nanoemulsion versus 2.5 mg/mL control, 4.0 mg/mL nanoemulsion versus 4.0 mg/mL control.

