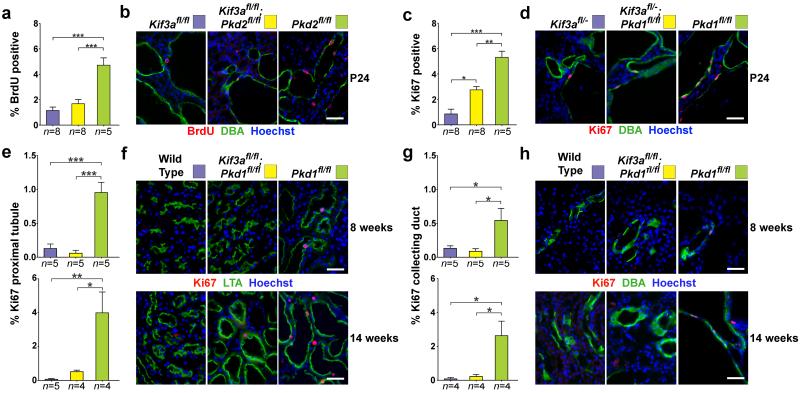
Figure 4. Loss of cilia in ADPKD suppresses cyst growth through reduction of cyst cell proliferation.
(a) Aggregate quantitative analysis of the percentage of BrdU-positive nuclei and (c) Ki67 positive nuclei and the respective representative images (b, d) at P24 in an allelic series of the specified genotypes using inactivation by Pkhd1-cre. Quantitation of proliferation was determined by counting the number of BrdU or Ki67 positive nuclei amongst at least 1000 DBA positive cells in each mouse. Aggregate quantitative data (e, g) and representative images (f, h) with the indicated genotypes combined with Pax8rtTA; TetO-cre at 8 and 14 weeks after the start of doxycycline induction (respective ages, 12 and 18 weeks). Segment-specific adult model proliferation rates were determined for proximal tubules (e, f) and collecting ducts (g, h). The color squares in b, d, f and h correspond to the respective genotypes in the histograms in a, c, e and g. The numbers of animals (n) in each group are indicated below the histogram bars. Multiple group comparisons were performed using one-way ANOVA followed by Tukey’s multiple comparison test and are presented as the mean ± SEM (***, P<0.001; **, P<0.01; *, P<0.05). Scale bar, 40 μm.

