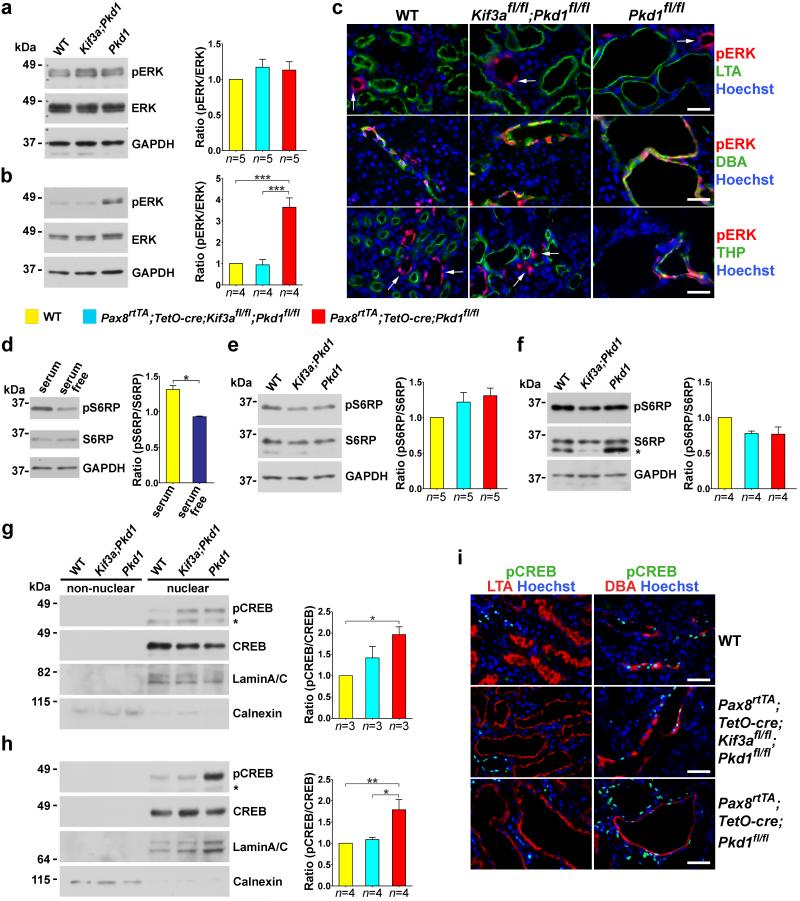
Figure 5. In vivo MAPK/ERK, mTOR and cAMP signaling as a function of cilia ablation in ADPKD.
(a-c) In vivo phosphorylation of ERK1/2 (pERK) in wild type, Pax8rtTA; TetO-cre; Kif3afl/fl; Pkd1fl/fl and Pax8rtTA; TetO-cre; Pkd1fl/fl at (a) 8 weeks and (b, c) 14 weeks after the start of induction with doxycycline. Representative immunoblots and aggregate densitometric quantitation of kidney lysates show that pERK is not increased in any genotype at 8 weeks (a) and is elevated at 14 weeks (b) only in the cystic Pkd1 single knockouts. (c) Immunohistochemical evidence of pERK expression at 14 weeks after induction is commonly found in CD irrespective of genotype; it is ubiquitously absent from proximal tubule irrespective of the extent of cyst formation; and it appears in thick ascending loop of Henle only in Pax8rtTA; TetO-cre; Pkd1fl/fl cystic mice. The increase in pERK in kidney lysates at 14 weeks is at least partly the result of increased cell mass of DBA positive CD cells comprising cysts. Arrows show positive pERK expression in segments other than proximal tubule (top panels) and thick ascending loop of Henle (bottom panels). (d-f) Phosphorylation of the mTOR pathway activation substrate S6RP. (d) Serum starvation of cultured cells is known to downregulate mTOR and result in decreased pS6RP, confirming the specificity of the antibody (n=4 for each group). Comparisons were performed using Mann-Whitney test and are presented as the mean ± SEM (*, P<0.05). (e, f) Representative immunoblots and aggregate densitometric quantitation of kidney lysates show no change in pS6RP irrespective of genotype and extent of cyst formation at (e) 8 weeks and (f) 14 weeks after the start of Cre induction suggesting that the mTOR pathway is not activated in these adult models. (*) in f, non-specific band. (g-i) In vivo cAMP-dependent phosphorylation of CREB (pCREB) at (g) 8 weeks and (h, i) 14 weeks after the start of Cre induction. Representative immunoblots and aggregate densitometric quantitation showing nuclear and non-nuclear fractions of kidney tissue lysates. pCREB activity is elevated at (g) 6 weeks and (h) 12 weeks only in Pax8rtTA; TetO-cre; Pkd1fl/fl cystic mice. (*) in g, h denote the phosphorylated form of cyclic AMP-dependent transcription factor ATF-1 that is known to cross react with the pCREB antibody. LaminA/C and calnexin are used to show relative nuclear enrichment and control loading. (i) Immunohistochemistry of pCREB expression at 14 weeks after induction shows nuclear staining in CD that is markedly increased in Pax8rtTA; TetO-cre; Pkd1fl/fl cystic mice. pCREB is completely absent from LTA positive PT irrespective of genotype or degree of cystic transformation. Pax8rtTA; TetO-cre; Pkd1fl/fl cystic mice also show increased pCREB in nuclei of segments that are negative for DBA (lower right panel). The color squares in the legend correspond to the respective genotypes in the histograms. The numbers of animals (n) in each group are indicated below the histogram bars. Multiple group comparisons were performed using one-way ANOVA followed by Tukey’s multiple comparison test and are presented as the mean ± SEM except as indicated above (***, P<0.001; **, P<0.01; *, P<0.05). Scale bar, 40 μm.

