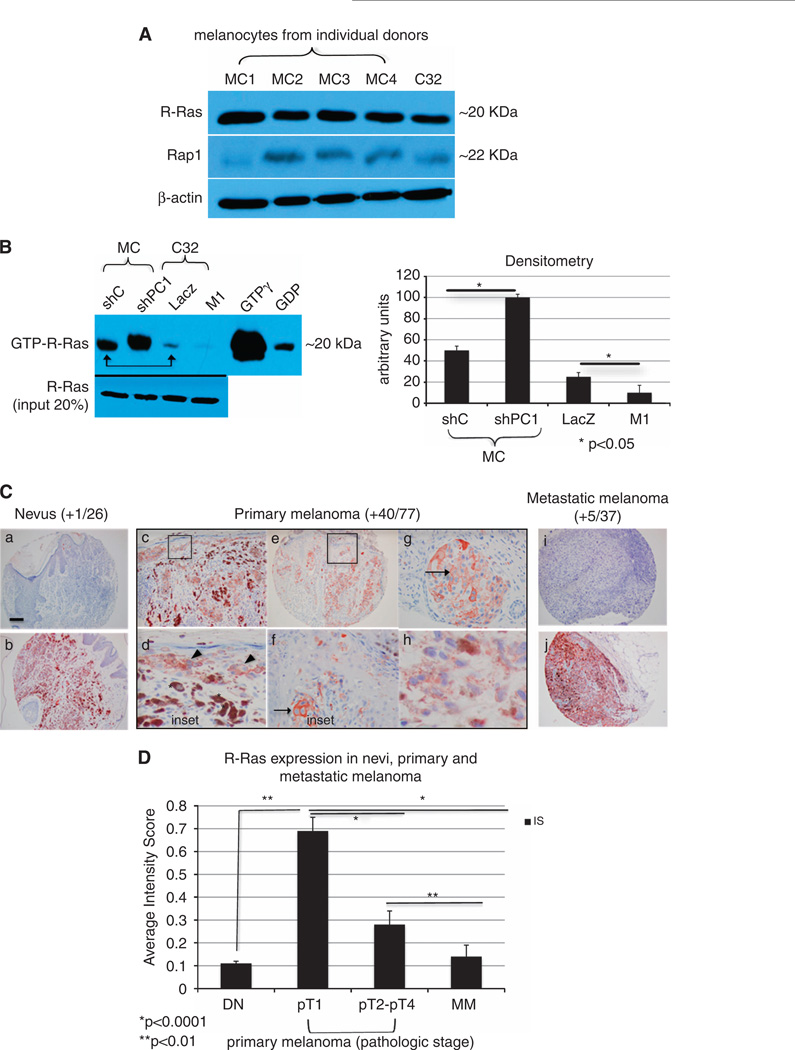
Figure 2.
Plexin C1 negatively regulates R-Ras activity in melanocytic cells. (A) Total cellular lysates of melanocytes (MC) from four individual donors, and C32 melanoma were blotted for R-Ras and Rap1. Shown is a 12% SDS–PAGE. Levels of R-Ras and Rap1 are similar in melanocytes and C32 melanoma, with higher levels of R-Ras compared with Rap1. (B) Affinity pull down of R-Ras performed on lysates of LacZ and M1 cells, and melanocytes silenced for Plexin C1 (~300 µg). A representative blot (n = 3) and densitometry, is shown. Melanocytes have higher levels of GTP-R-Ras under basal conditions compared with melanoma (arrow), which was further increased by silencing Plexin C1. In melanoma, detectable GTP-R-Ras was identified in control cells, which was completely lost in cells expressing Plexin C1. Shown is a 12% SDS–PAGE blotted for R-Ras. (C) R-Ras expression in melanocytic lesions in vivo. Shown are representative photomicrographs of nevi, primary melanoma and metastatic melanoma stained for R-Ras and counterstained with hematoxylin. The majority of nevi and metastatic melanoma did not expression R-Ras (a, i), but those that did showed strong staining (b, j). Expression of R-Ras in primary melanoma was frequently observed (c–h), with particularly strong, membranous staining in the in situ component of early (pT1) melanomas (inset). Asterisks show macrophages with ingested melanin, which also expressed R-Ras. Arrows show R-Ras on the cell membrane. Bar ~1 mm. (D) R-Ras expression, shown as an averaged intensity score (IS) for primary melanoma by pathologic stage, and metastatic melanoma (MM). Differences in R-Ras expression between primary melanomas pT1 and pT2-pT4 are significant, as are differences between primary melanomas (pT1–pT4) and metastatic melanoma. Each bar represents the average IS ± s.e.m.

