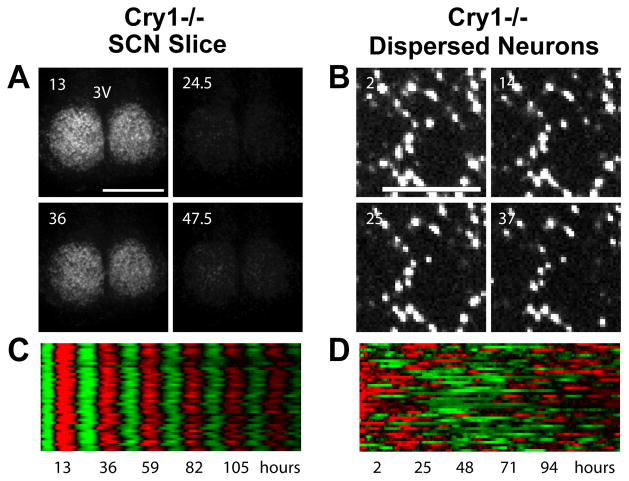
Figure 4.
Patterns of PER2::LUC bioluminescence recorded from mutant Cry1−/− neurons in a cultured slice (A, C) or in dispersed culture (B, D) over a period of six days. Bioluminescence images are shown above (A, B), from indicated times in hours after start of the experiment. Raster plots are shown below (C, D), with each horizontal line representing one cell, and values above and below the mean shown in red and green, respectively. Cry1−/− neurons are rhythmic and synchronized in SCN slices, but are not rhythmic in dispersed culture. Figure from Liu et al. (17), with permission from Elsevier.

