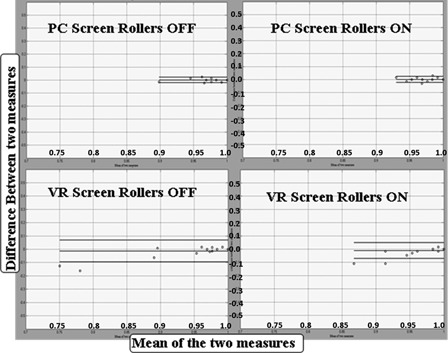
Figure 3.

Bland-Altman plot showing agreement between the total VPMRT scores from Clinician 1 and Clinician 2 for the four driving conditions. The horizontal lines represent overall mean and two standard deviations of differences in ratings from the two clinicians.
