
Figure 2.
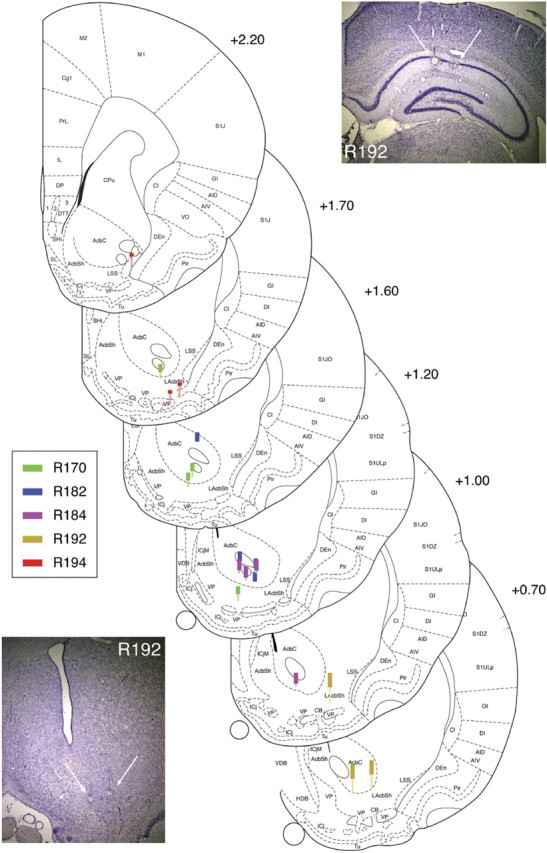
Recording locations. Thick lines indicate estimated recording areas based on distance from final recording locations identified histologically (bottom of thin lines). Colors correspond to different subjects. All subjects were implanted in the right hemisphere; coordinates are relative to bregma. Example cresyl-violet-stained brain sections shown from one subject (R192); final electrode locations can be seen from the small round electrolysis marks (white arrows). Ventral striatal recording locations were all estimated to be from the nucleus accumbens core and shell; although some electrodes passed through the anterior commissure, this tended to be clearly apparent as a quiet area for recording, and electrodes were rapidly advanced until neuronal activity was reacquired. Figure based on Paxinos and Watson (1998).