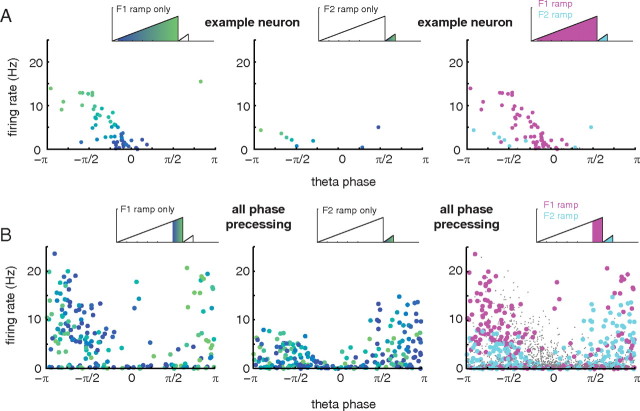
Figure 8.
Relationship between firing rate and theta phase in ventral striatal ramp neurons. A, Phase/rate scatter plots for the example neuron in Figure 3. Each data point in the plots corresponds to one bin in the tuning curve of the neuron over the (linearized) track. Left, Phase/rate scatter plot for the firing rate ramp up to the first reward site (F1); the color of each dot corresponds to position along the ramp. Note the clear phase precession (from 0 to approximately −π radians) as the reward site is approached (color change from blue to green). Middle, Phase/rate scatter plot for the firing rate ramp up to the second reward site (F2). Note the much shorter, but clearly visible, sequence of phase precessing data points in the bottom left of the plot. Right, The F1 and F2 firing rate ramps occupy a distinct area of the phase/rate plot: the same theta phase (e.g., −π/2) is associated with different firing rates for two ramps. This can also be seen in the example phase plot in Figure 3, top right. B, This pattern held across all phase precessing neurons (n = 47). For clarity, only spatial bins for which theta firing phase could be estimated with 95% confidence intervals equal to or smaller than π/4 were included in both plots, and the range of spatial locations included was matched for the F1 and F2 ramps; see the schematics above each scatter plot for included regions.

