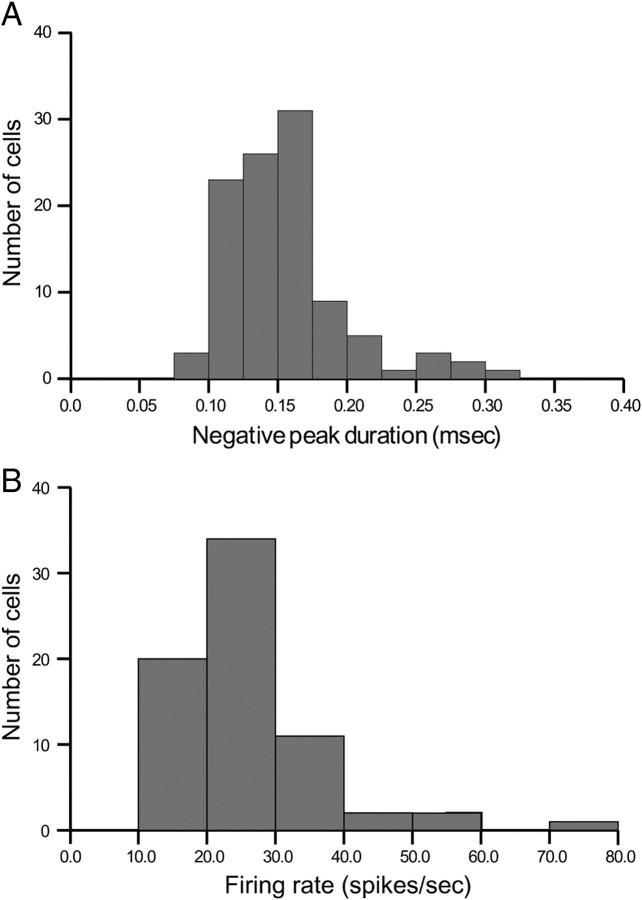
Figure 2.
A, Histogram of the durations of the initial negative-going peak of interneuron spike waveforms. Classification according to negative-going peak duration was in excellent agreement with other criteria; there was a discrepancy only for the single cluster whose initial peak duration was >300 μs. B, Histogram of the overall firing rate for interneurons. The mean value was 20.8 spikes/s.

