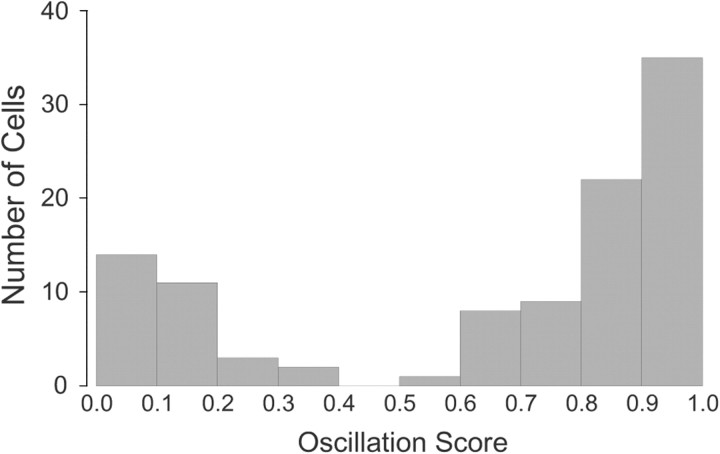
Figure 4.
Histogram of oscillation score values (defined in text) for 104 interneurons. The distribution is strongly bimodal such that there are no values in the range 0.4–0.5. Choosing a threshold of 0.45 thus separates the sample into two distinct groups such that high values are for theta-modulated cells and low values are for theta-independent cells.

