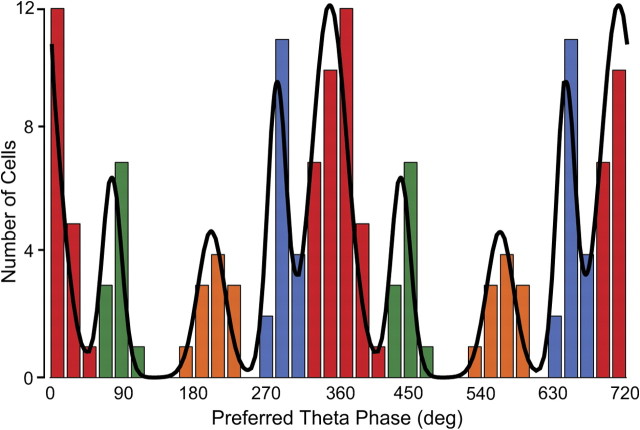
Figure 7.
Histogram of preferred theta firing phases (two cycles are shown) for 74 theta-modulated interneurons. The color code emphasizes that there are four preferred phase modes. In this code, class 1 is red, class 2 is green, class 3 is orange, and class 4 is blue. The continuous line represents the sum of fits to four von Mises distributions whose means and dispersions are stated in the text. Note that the blue bin between 300° and 320° contains one cell from class 1. A remarkable feature of the distribution is the isolation of class 3 cells from the others.

