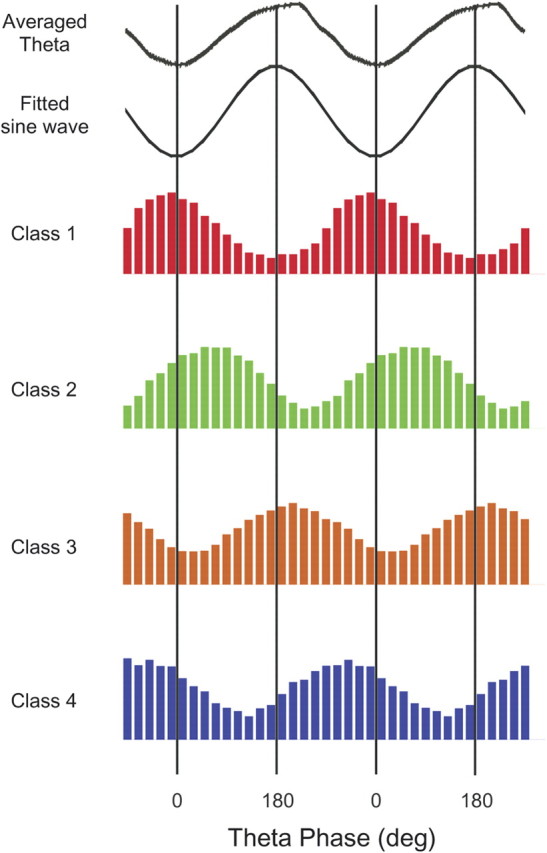
Figure 8.

Phase histogram examples for one interneuron selected from each of the four preferred phase classes; the color code is the same as in Figure 7. The histograms are binned at 20°. The top panel shows the filtered, averaged theta activity recorded at the same time as the class 1 cell. The fitted sine wave shows the sine wave that would have been chosen to represent the negative half of the theta cycle. The preferred phase (middle of the preferred bin) and number of spikes for the four examples are as follows: class 1—350°, 590 spikes; class 2—50°, 1082 spikes; class 3—210°, 2110 spikes; class 4—310°, 1532 spikes.
