
Figure 9.
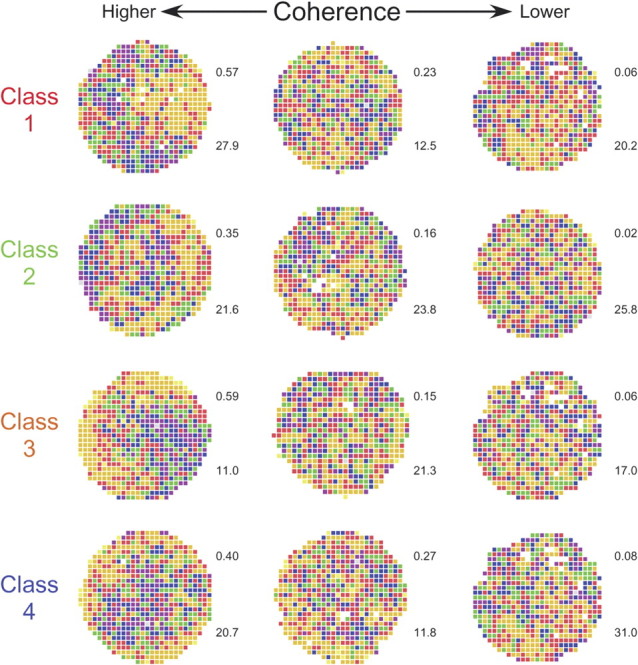
Color coded firing rate map examples for each of the four preferred phase classes. The example interneurons were chosen to illustrate the large spatial coherence range for each class, suggesting that there is not a strong differential contribution of the different classes to the great spatial firing specificity of place cells. (Spatial coherence was calculated as the z-transform of the firing rate correlation between each pixel and its neighbors—see Materials and Methods.) The number to the upper right of each map is the coherence (see Materials and Methods); the number to the bottom right of each map is the average firing rate for the entire recording session.