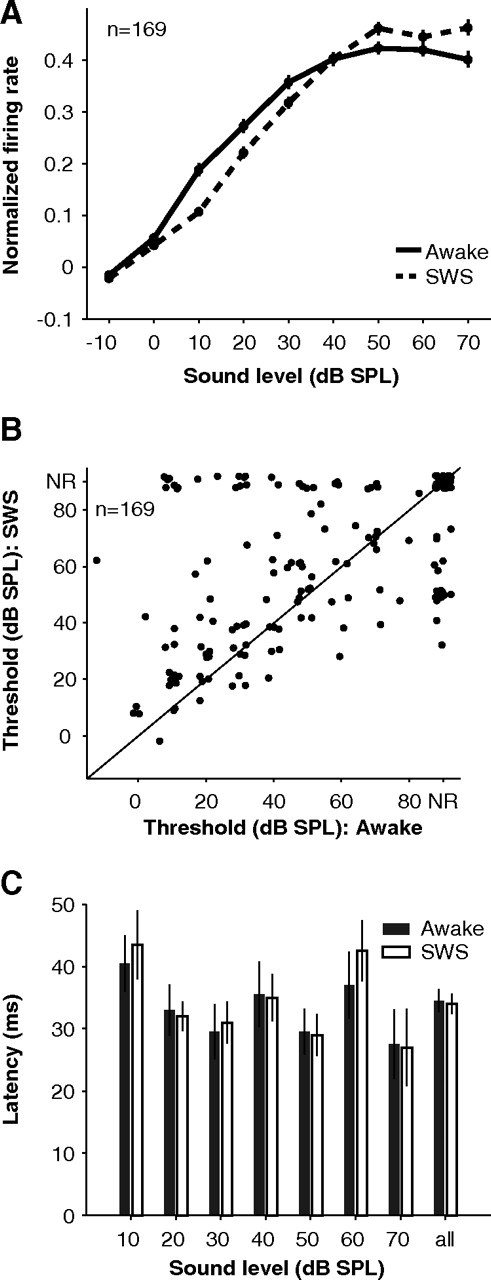
Figure 2.

Acoustic thresholds and latencies during SWS. A, Population intensity tuning data in awake (solid) and SWS (dashed). Error bars represent ± 0.5 SEM. Individual tuning curves for each neuron were first normalized by their peak value in either awake or SWS before being averaged. B, Elevated sound level thresholds in SWS compared with wakefulness (p = 0.01, Wilcoxon rank sum, n = 169; NR, not responsive according to a 4*SEM criterion and assigned a threshold of 90 dB SPL). C, Response latencies in SWS (open bars) were similar to those in wakefulness (filled bars) across all sound levels tested (median latency awake = 34.5 + 1.9 vs SWS = 34.0 + 1.7 ms, p = 0.71, Wilcoxon rank sum, n = 244, “all” condition).
