
Figure 3.
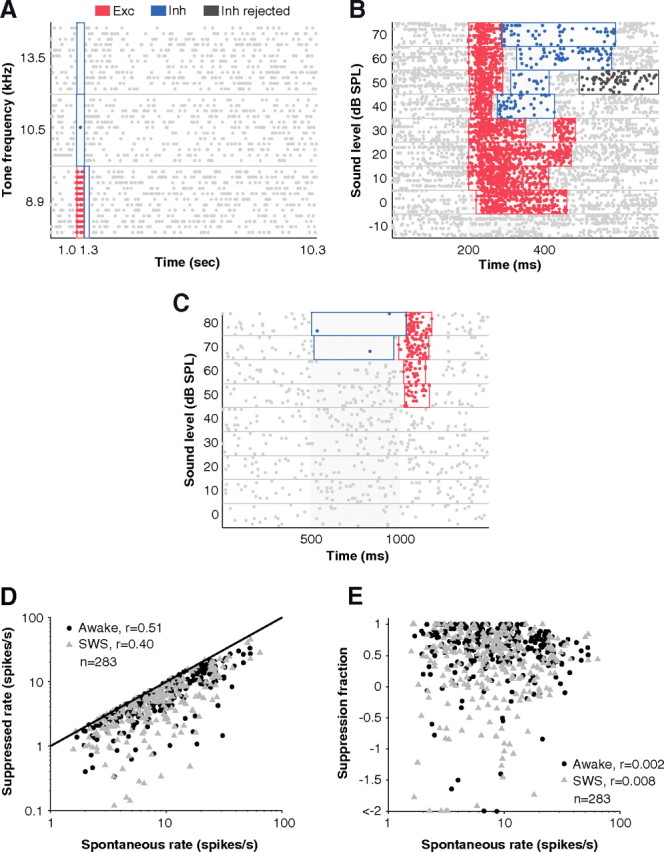
Detection of suppressed events and dependence on spontaneous rate. A, Well defined periods of excitation (Exc; red) and inhibition (Inh; blue) were detected among a background of high spontaneous firing by the windowing algorithm (see Materials and Methods). No false windows were detected in the 9-s-long period of spontaneous firing following the stimulus. B, The varying durations of excitatory responses were well captured by the algorithm. At higher sound levels, excitation was shorter in duration and was followed by inhibition. In some cases, an inhibitory window was detected by the algorithm but then thrown out (dark gray) because it did not pass a post hoc permutation test for the means when compared with spontaneous firing. C, An example where inhibition preceded excitation at high sound levels. Note that windows were non-overlapping even though excitatory and inhibitory algorithms were run independently. D, Suppressed rates which were already spontaneous-rate subtracted were still highly correlated with spontaneous rates (r = 0.45, p < 0.01, Pearson's correlation coefficient, n = 566), suggesting a scaling relationship between spontaneous rate and suppression. At higher spontaneous rates, higher suppression can be observed extracellularly. This was not a ceiling effect where spontaneous rates limited the amount of suppression that could be observed extracellularly since in most cases firing rates were not suppressed to 0 (i.e., suppression = spontaneous; unity line). E, For the analyses of Figures 4B and 6B in Results, suppressed rates were normalized by spontaneous rate to obtain the fraction of spontaneous rate that was suppressed. This measure removed correlation with spontaneous rate (r = 0.002, p = 0.26, Pearson's correlation coefficient, n = 566).