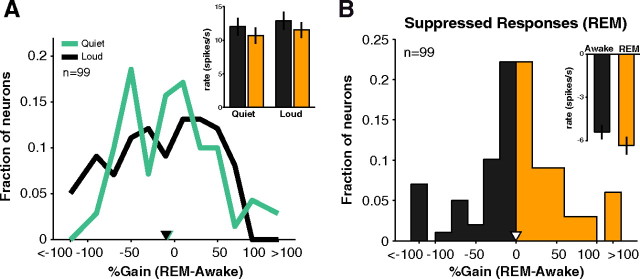
Figure 6.
Driven and suppressed responses in REM. A, For A1 neurons that responded in either the quiet (0–20 dB) or loud (70–90 dB) sound level regimes, little difference was seen in REM modulation of responses (median gain quiet = −1.3% vs loud = −5.3%, p = 0.28, Wilcoxon rank sum, n = 63). No clear difference was apparent in population firing rates for quiet sounds (awake = 12.0 + 1.3 vs REM = 10.7 + 1.2 spikes s−1, p = 0.35, Wilcoxon rank sum, n = 67). Inset, Black, awake; orange, REM). B, Percentage change of suppressed responses during REM in A1. The distribution is near 0 (mean = −0.3%, inverted white triangle), indicating that the strength of suppression was similar in awake and REM, which can be seen in mean population suppression (inset).

