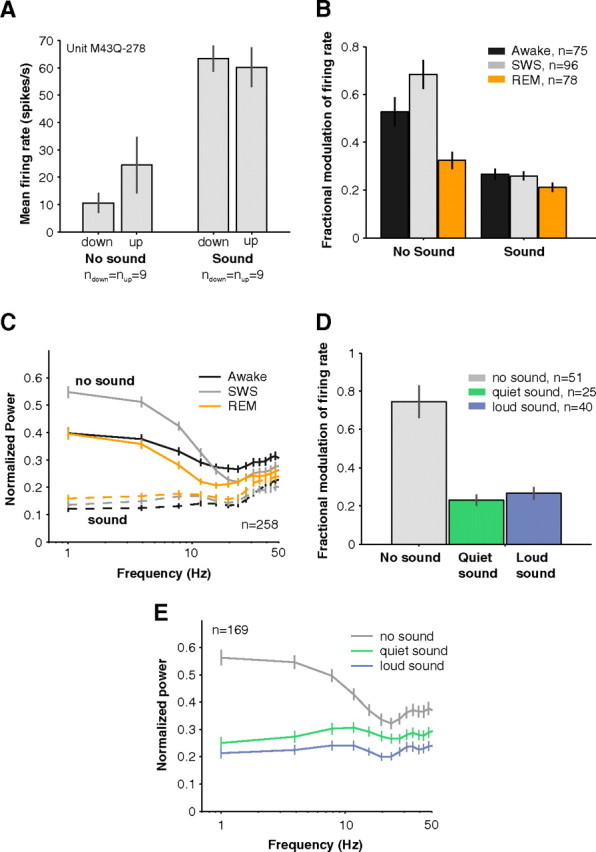
Figure 7.

Influence of slow rhythms on neural activity in awake, SWS, and REM. A, An example neuron whose background activity showed EEG state-dependent firing rate modulation (left bars). Trials (n = 35) were divided into quartiles based on EEG amplitude. Trials in the lower quartile (n = 9) and the upper quartile (n = 9) were compared for effects of firing rate modulation with EEG amplitude. During EEG down states, this example neuron's firing rate was reduced by more than half. Upon acoustic stimulation with a 11.9 kHz pure tone (70 dB SPL), there was no longer a difference in total firing rates between up and down EEG states (right bars, spontaneous firing rate not subtracted). Error bars represent ±1 SEM. B, EEG amplitude modulated spiking especially when no sounds were playing in SWS (gray bar, no sound condition). Effects were generally stronger in SWS than in REM (orange) or wakefulness (black). During acoustic stimulation, however, modulation of spike rate by EEG amplitude became much weaker compared with the activity evoked by sounds (compare no sound to sound conditions; SWS: no sound = 68 ± 6% vs sound = 26 ± 2%, p < 0.01, Wilcoxon rank sum, n = 96) and slow rhythm modulation no longer differed between SWS and wakefulness (sound condition: SWS = 26 + 2% vs awake = 27 + 2%, p = 0.85, Wilcoxon rank sum, nSWS = 96, nAwake = 75). Only neurons with spontaneous rates > 3 spikes s−1 were included in this analysis so that appreciable variability occurred in trial firing rates. Error bars represent ±1 SEM. C, Locking of spontaneous activity to low-frequency EEG rhythms was enhanced in SWS compared with wakefulness (solid gray and black lines). This cannot be simply explained by the stronger power in the low-frequency EEG in SWS since the spike-field coherence measure normalizes for differences in EEG power across the different behavioral states (see Materials and Methods). In general, locking to low-frequency rhythms was poor while sounds were being played (dashed lines). Error bars represent ±1 SEM. D, High (top quartile of EEG amplitudes) and low (bottom quartile) trials could cause a 75 ± 9% swing in firing rates as seen in the overall modulation in spontaneous firing rate between up and down periods (black bar). This modulation with EEG amplitude, however, was reduced to 27 + 3% and 23 + 3% during playing of quiet (green, 0–20 dB) and loud (blue, 70–90 dB) sounds respectively (p(no sound vs quiet sound) = 1.4*10−5, p(no sound vs loud sound) = 5.5*10−6, Wilcoxon rank sum, nno sound = 51, nquiet = 25, nloud = 40). Only neurons with spontaneous rates > 3 spikes s−1 were used in this analysis. Otherwise, if firing rates were too low, little trial-by-trial variation could be observed. Error bars represent ±1 SEM. E, The SFC was strongest for low frequencies indicating that spikes were locked to slow brain rhythms. This locking was strongly diminished whether quiet (0–20 dB) or loud (70–90 dB) sounds were played (SFC at 1 Hz: no sound = 4.3*10−3 + 0.4*10−3 vs quiet sound = 2.1*10−3 + 0.3*10−3 mV2 vs loud sound = 1.8*10−3 + 0.4*10−3 mV2, p(no sound vs quiet sound) < 0.01, p(no sound vs loud sound) < 0.01, Wilcoxon rank sum, n = 169). Error bars represent ±1 SEM.
