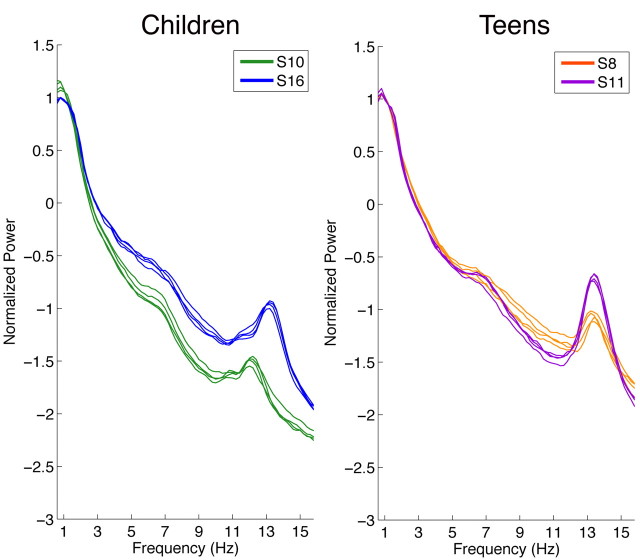
Figure 3.
Correct clustering in children and teens. Normalized all-night NREM sleep spectra of two representative participants in each cohort whose 4 nights clustered correctly. All 4 nights from a participant are shown in one color, and spectra from different individuals are shown in different colors. Children are depicted on the left (participant numbers: S10 and S16), and teens on the right (participant numbers: S8 and S11). Power density is plotted on a logarithmic scale.

