
Figure 4.
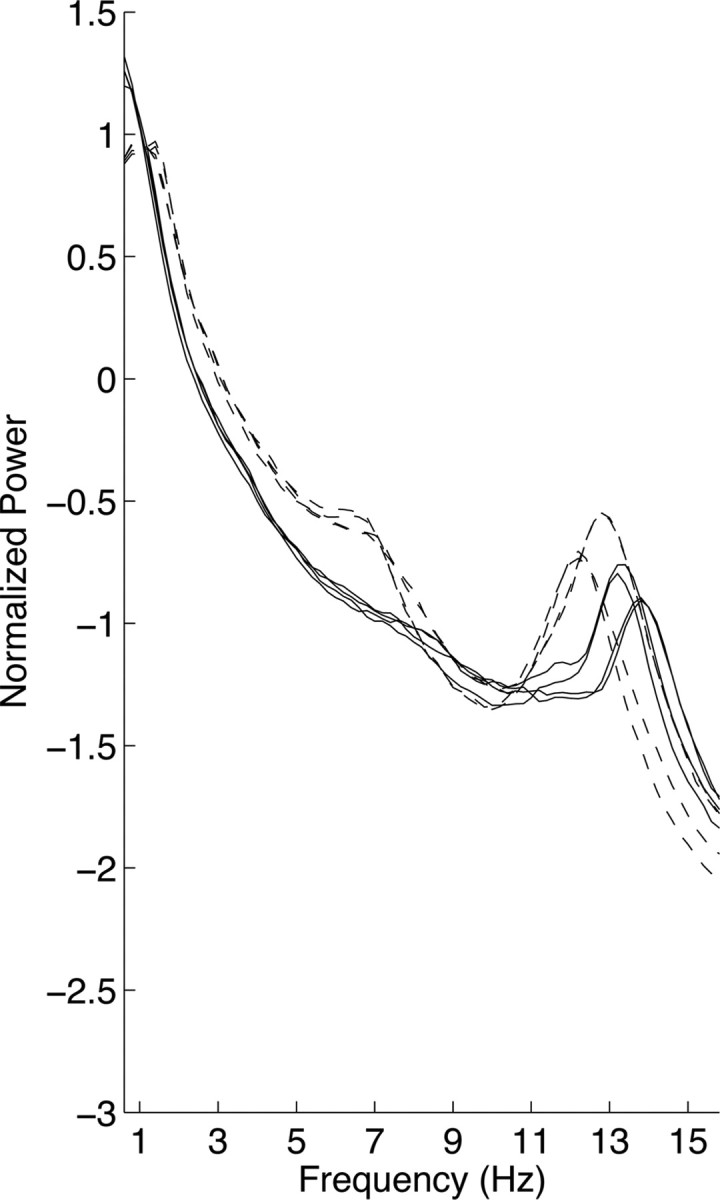
A child and a teen who do not cluster. All-night NREM sleep spectra of 4 nights from one child (participant number S1; dashed lines) and one teen (participant number S1; solid lines) whose consecutive nights, but not all 4 nights, cluster. Note that the spectra on consecutive nights for the child overlap for most frequencies. Power density is plotted on a logarithmic scale.