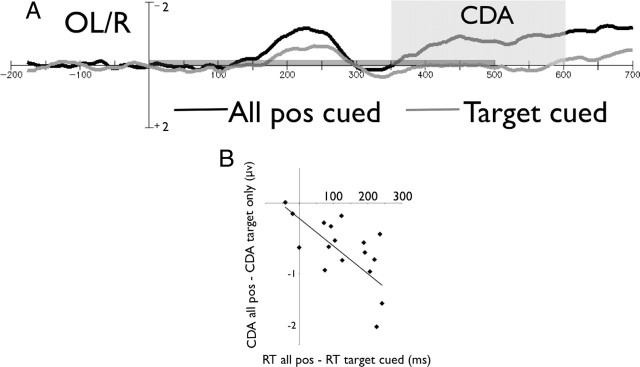
Figure 2.
Results for experiment 1. A, The CDA for the neutral (all positions cued) and the target cued conditions, time locked to the stimulus array. The gray bar above the x-axis indicates the stimuli presentation time. B, Correlation between (CDA neutral − CDA target cued) and (RT neutral − RT target cued).

