
Figure 9.
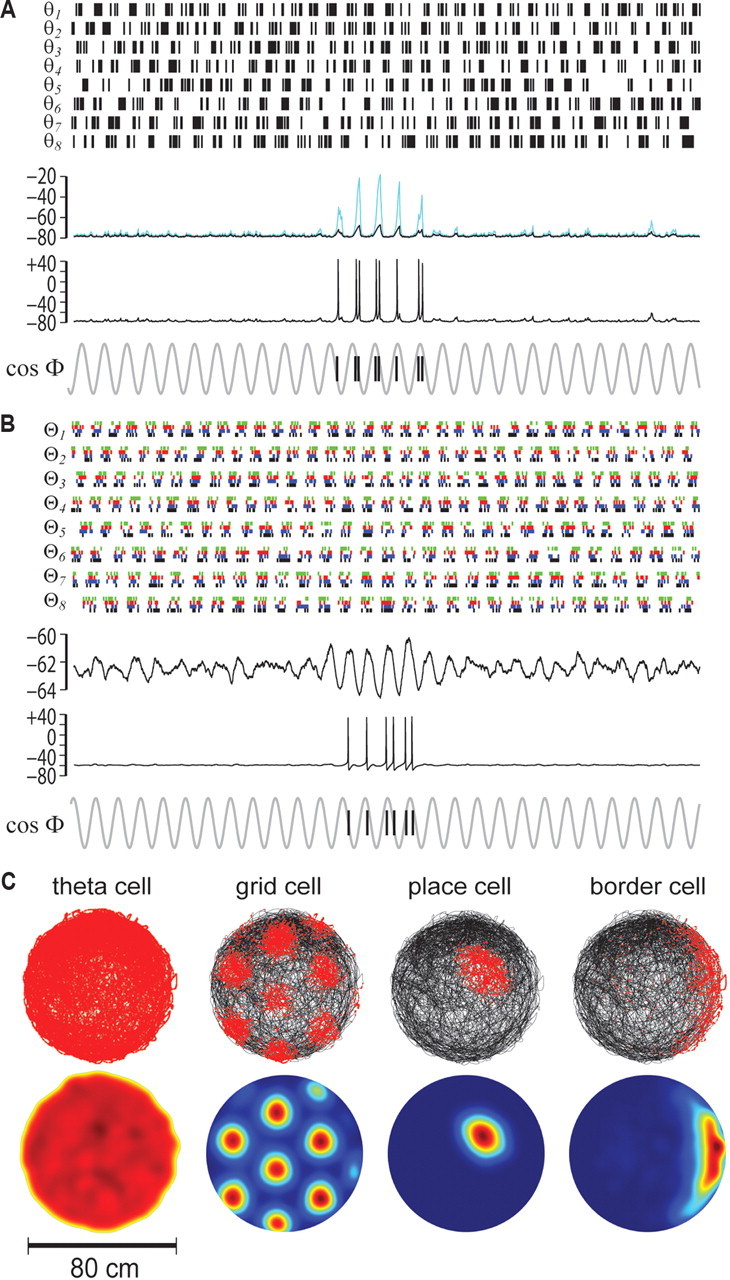
Biophysical simulations of spatially tuned neurons formed from theta cells. A, Simulated rat runs at 25 cm/s along a linear track; a postsynaptic neuron receives inhibitory input from eight theta cells, modeled as Poisson spike trains generated from cosine VCO functions (θ1–θ8) shown in Figure 7A. The top trace shows membrane voltage (Vm) for simulations with a purely passive membrane (black) or with NaP current but no spike channels (blue); the bottom Vm trace shows simulations with both NaP and spike channels. At the bottom, the raster plot shows phase precession of spikes with respect to the VCO reference phase, Φ (Eq. 17). B, Same as A except that the target neuron now receives excitatory input from 32 theta cells, divided into eight groups (Θ1–Θ8) that each consist of four Poisson spike trains (shown in different colors) that were independently generated from VCO functions (θ1–θ8) in Figure 7A. The top trace shows membrane voltage (Vm) for simulations with a purely passive membrane; the bottom Vm trace shows simulations with spike channels (NaP currents were not included in simulations with excitatory theta inputs). At the bottom, the raster plot shows spike phase precession with respect to Φ, as in A. C, Path and firing rate plots for spike trains of a simulated theta cell, grid cell (formed by 3 theta cells), place cell (formed by 12 theta cells), and border cell (formed by 9 theta cells), all modeled from 60 min of behavior data collected in the 80 cm cylinder.