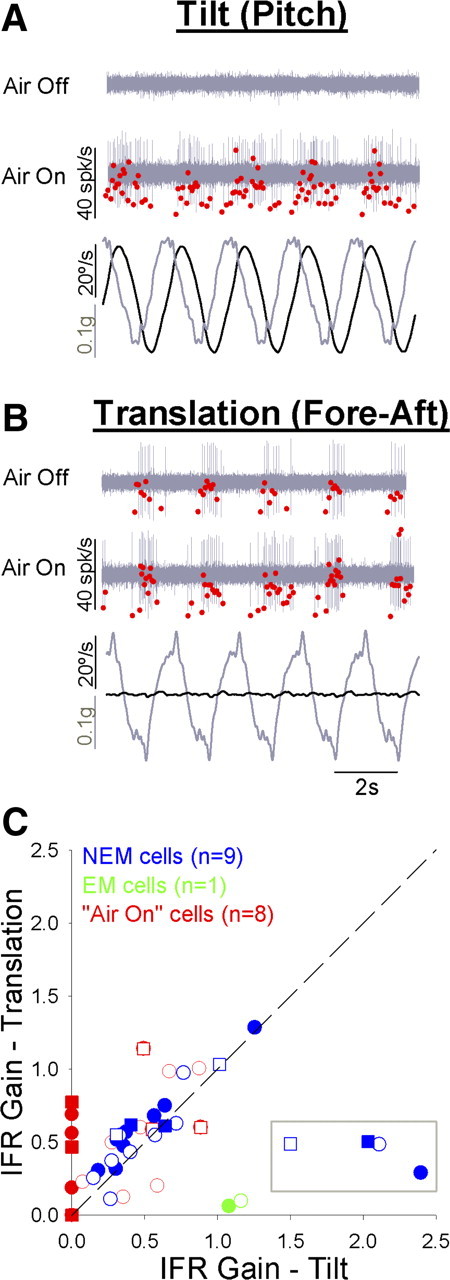
Figure 6.

Comparison of responses to rotational (tilt) and translational (apparent tilt) stimuli. A, B, Representative air-on neuron response to head-fixed 0.5 Hz tilt (A, pitch, 20°/s) and translation (B, fore–aft, 0.1G). Stimulus traces (bottom of each panel) show angular velocity (black) and linear acceleration (gray) components of each stimulus. Neural responses are shown for the same air-on neuron during default (Air Off) and flight (Air On) states. Neural waveforms are shown in gray, and the corresponding IFR values are overlaid in red. C, Comparison of rotational and translational gain values across neurons, expressed relative to apparent tilt velocity (see Materials and Methods). Data are plotted for all air-on (red, n = 8), EM (green, n = 1), and NEM (blue, n = 9) neurons for which data were available, and all appropriate data from a single neuron were included (responses to either one or two motion axes per unit). Circles, Pitch rotation/fore–aft translation; squares, roll rotation/lateral translation. Data points inside of the gray box (C) belong to a single NEM neuron identified as an outlier (see Results).
