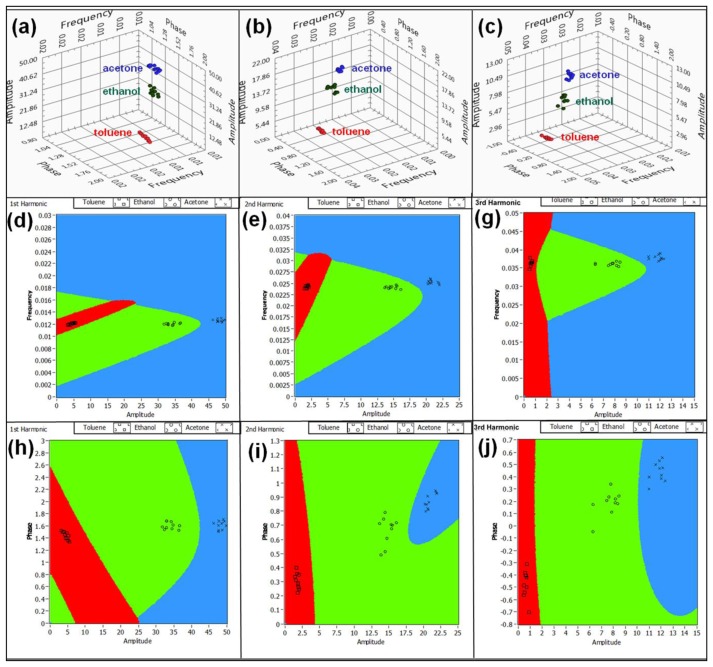
Figure 6.
Visualization of the projections of 60-dimentional hyperspace (a–c). Clouds of points corresponding to different analyte exposures in 3-D (amplitude, frequency, phase) coordinate systems, corresponding to the first (a), second (b) and third (c) harmonics. Visualization of the quadratic discriminant analysis for the first (d,h), second (e,i) and third (g,j) harmonics.

