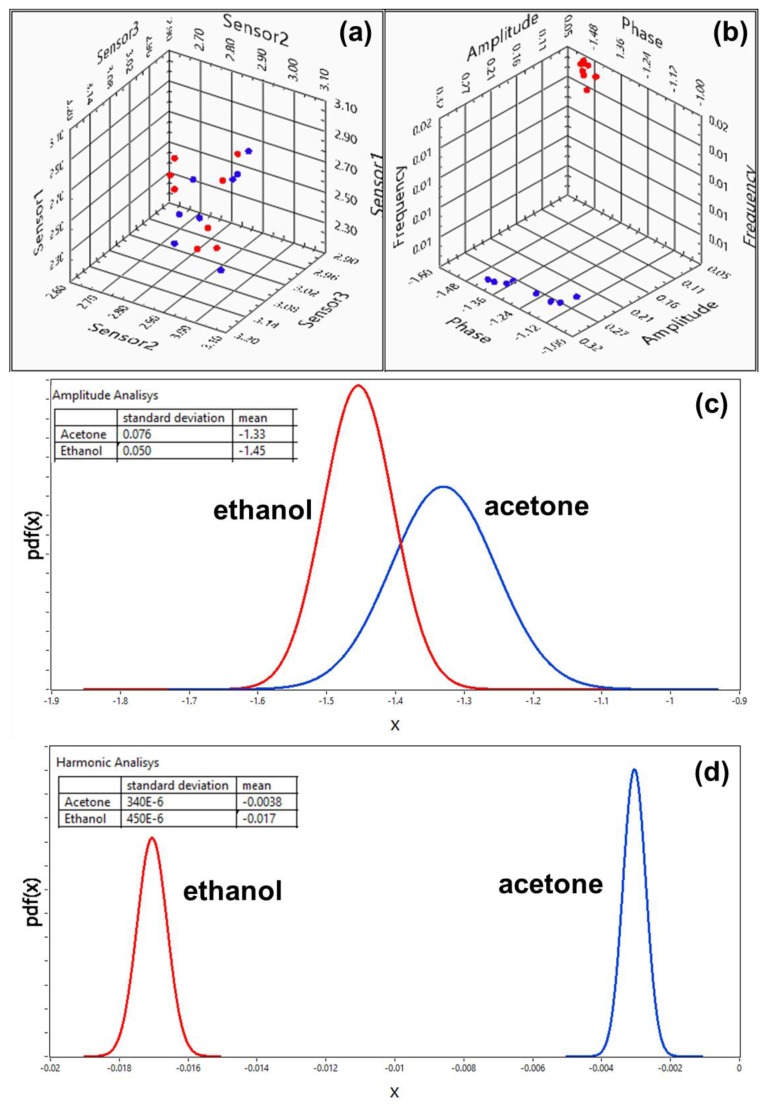
Figure 7.
Separation of classes in the (a) hyperspace of steady-state responses of multi-sensory system (b) sub-space of the first harmonic extracted from the transient response. Probability density for acetone and ethanol for steady-state (c) and harmonic (d) analysis. Coordinate x was obtained by transformation of coordinates according to Fisher's criteria of LDA.

