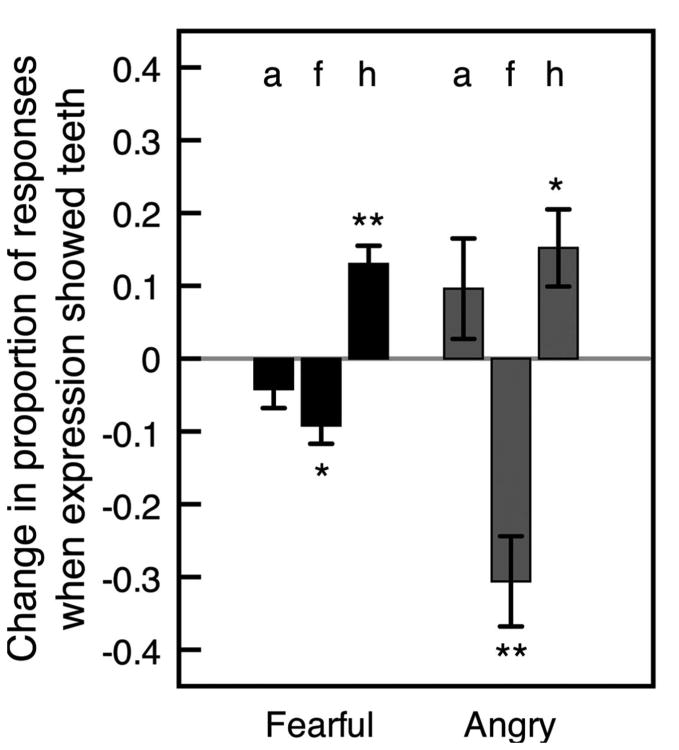
Figure 5.
Mean difference in proportion of each type of categorization between trials on which fearful and angry expressions clearly showed teeth and trials on which they did not show teeth (on trials with correct emotion detection). Positive values indicate that a categorization (a = angry, f = fearful, or h = happy) was given more often when the expression (fearful or angry) clearly showed teeth. Differences are arcsin adjusted to offset compression at high proportion values. Error bars indicate ± 1 SEM (adjusted for within-observer comparisons).

