Figure 6.

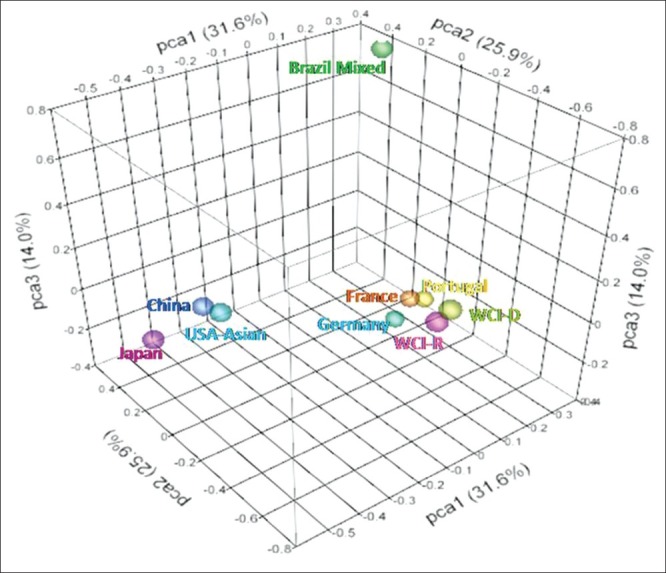
Principal component analysis of genotypic frequencies of HLA-A,-B and-DRB1 loci. Total variance was partitioned in to three components. Three-dimensional scattered plot showing clustering of different populations into three groups

Principal component analysis of genotypic frequencies of HLA-A,-B and-DRB1 loci. Total variance was partitioned in to three components. Three-dimensional scattered plot showing clustering of different populations into three groups