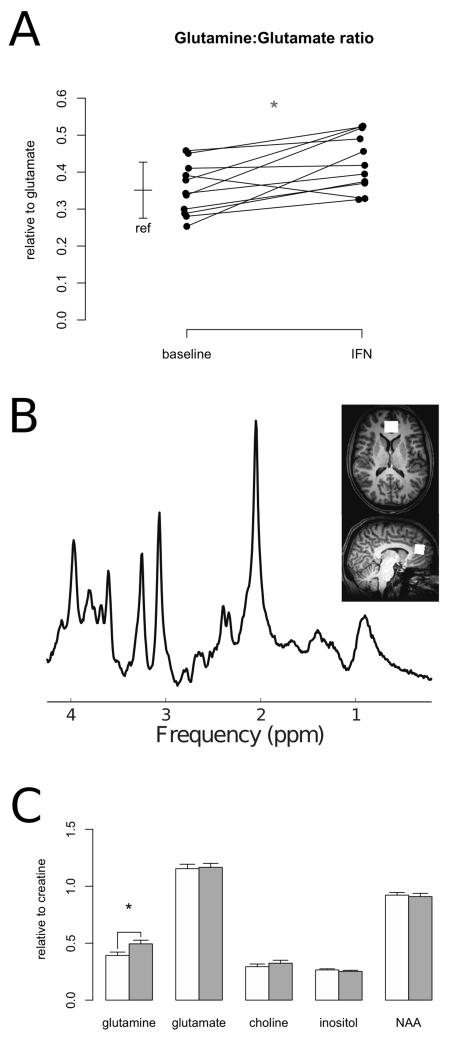
Figure 1.
A: Glutamine:glutamate ratio at baseline and during treatment with interferon-a (IFN). Bar: reference values (mean and standard deviation) for healthy controls with this method.
B: Sample SPECIAL spectrum and voxel position in anterior cingulate cortex.
C: MRS measures at baseline (white) and during interferon treatment (grey). NAA:N-acetyl-aspartate. *: p<.05.

