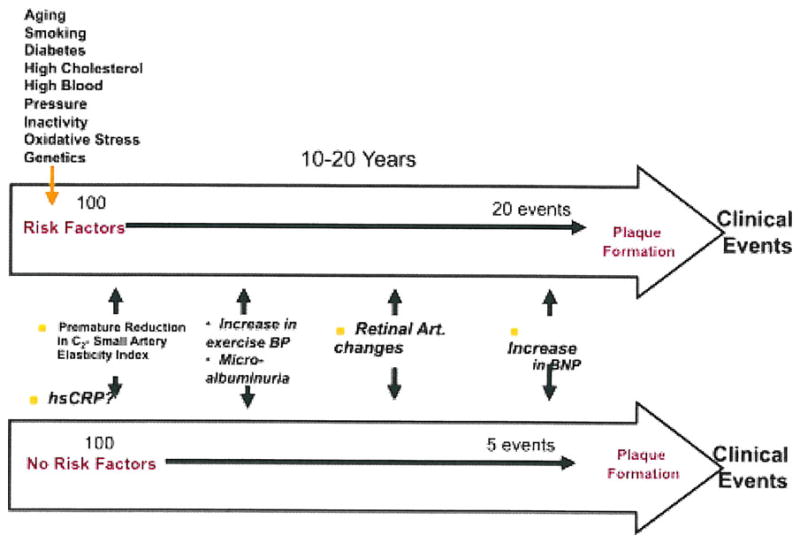
Fig. 1.

The top arrow is a hypothetical example of a 20% (high Framingham Risk Score) 10–20 year risk of suffering a cardiovascular event, whereas the bottom arrow indicates someone with a low Framingham Risk Score. The risk markers indicate an approximation of where, along the evolution of the natural history of coronary artery disease, the risk markers may become abnormal. Art artery; BNP B-type natriuretic peptide; BP blood pressure; hsCRP high-sensitivity C-reactive protein
