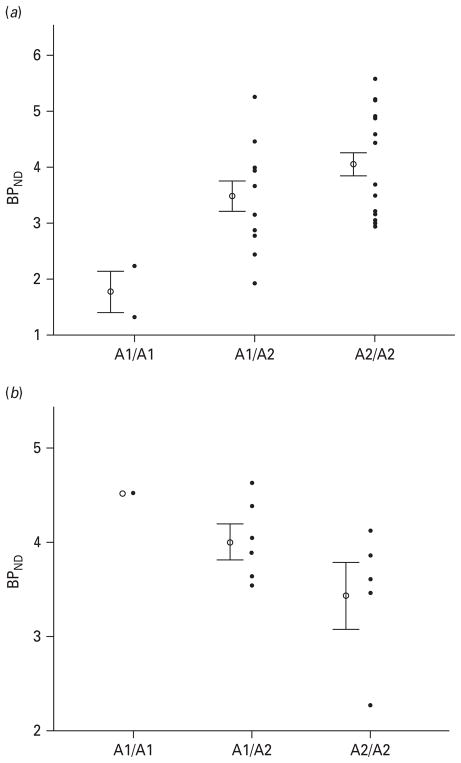
Fig. 2.
(a) Scatterplot of baseline dopamine D2/3 receptor binding potential (BPND) in the middle caudate of healthy controls stratified according to genotype. The error bars represent the standard error of the mean. The BPND mean± S.D. for each genotype is as follows: A1/A1=1.8±0.64; A1/A2 =3.5±1.0; A2/A2=4.0±0.96. (b) Scatterplot of baseline D2/3 receptor BPND in the middle caudate of major depressive disorder patients stratified according to genotype. The error bars represent the standard error of the mean. The BPND mean± S.D. for each genotype is: A1/A1=4.5; A1/A2=4.0±0.42; A2/A2=3.5±0.71.

