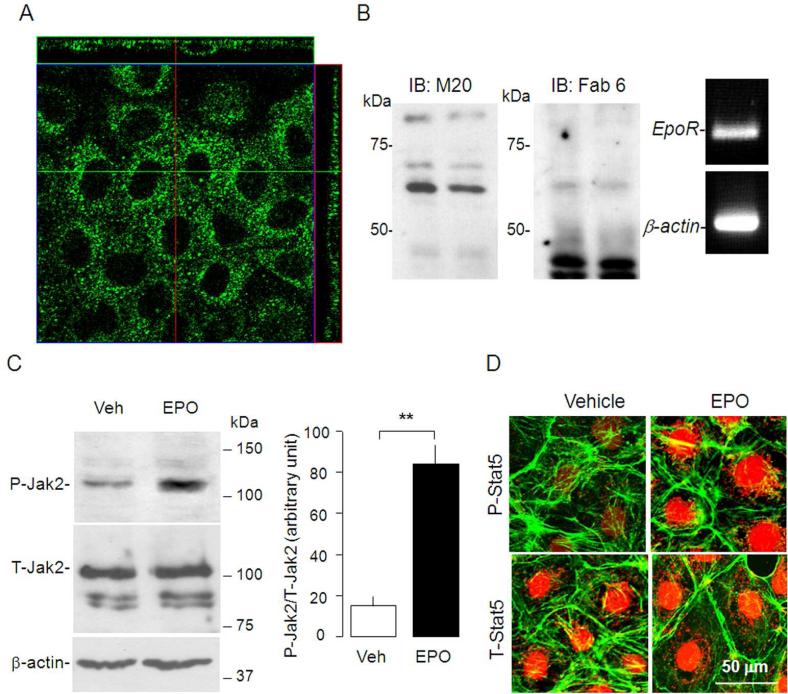
Figure 4. Expression of EpoR in NRK cells.
(A) Immunocytochemistry for EpoR in NRK cells. Confocal fluorescent images in xy, yz, xz planes. (B) Left and middle panel: Representative immunoblots for EpoR with M-20 (left panel) and with Fab 6 (middle panel) in total lysate of NRK cells. Right panel: RT–PCR of EpoR transcript in NRK cells. (C) NRK cells incubated with culture media containing 10% FBS and treated with EPO (100 IU/ml) or vehicle (Veh) for 10 minutes and total lysates were immunobloted for phosphorylated Jak2 (P-Jak2) and total Jak2 (T-Jak2) (left panel). Summarized data as mean ± SD (right panel) (D) Representative immunocytochemistry for phospho-Stat5 (P-Stat5) and total Stat5 (T-Stat5) (red) in NRK cells treated with EPO or vehicle (Veh). β-actin (green) served as counterstain.

