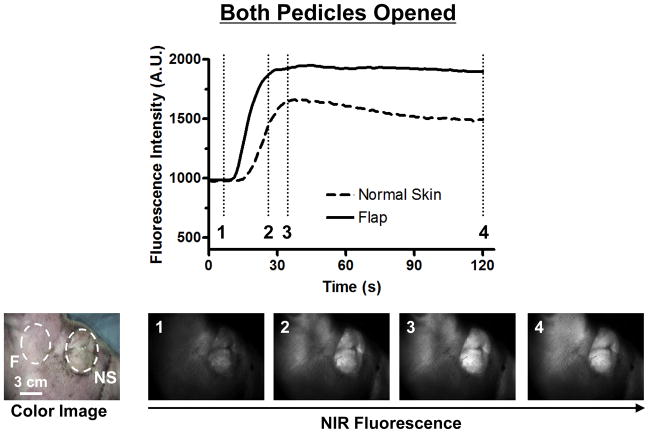
Figure 3. Fluorescence Intensity and NIR Fluorescence Imaging (Both Pedicles Opened Model).
1.3 mg of ICG was injected as a rapid bolus into the femoral vein. Fluorescence intensity (FI) over the normal skin (NS) and flap (F) are shown (top). Color image and NIR fluorescence images at the indicated time point (vertical dash line in top) are shown (bottom). ROIs are indicated by the dash circles on each flap.

