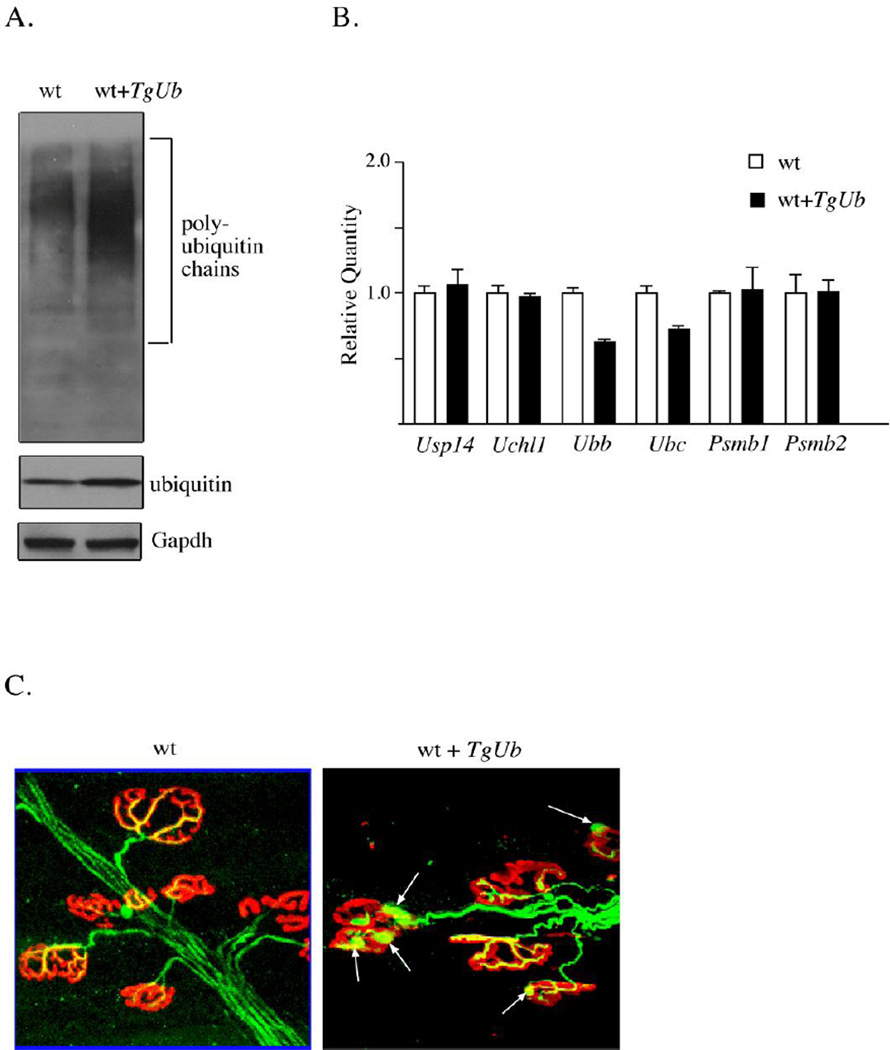
Figure 2.
Effects of ubiquitin overexpression on the mouse nervous system. (A) Representative immunoblot of ubiquitin levels from the brains of 6-week-old wild type mice (wt) and wild type mice containing the Thy1-ubiquitin transgene (wt + TgUb). Gapdh was used as a loading control. (B) Quantitative PCR was performed on reversetranscribed RNA isolated from brains of 6-week-old wild type (wt) and wild type ubiquitin transgenic mice (wt+TgUb). Data are shown as mean ± SE, where n = 3 animals per genotype. (C) Tibialis anterior muscles were prepared from 6-week-old wild type mice (wt) and wild type mice containing the Thy1-ubiquitin transgene (wt + TgUb). Muscles were stained for neurofilaments (green) and acetylcholine receptors (red). Arrows indicate neurofilament accumulations.

