
Fig. 3.
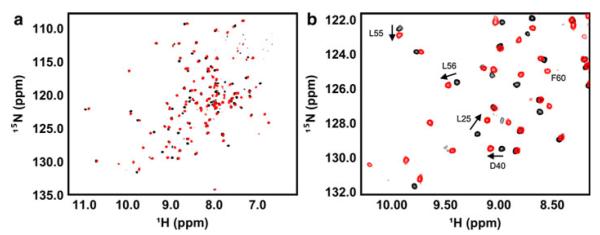
Comparison of the NMR spectra of UBE2W-WT and UBE2W-KK. a Full 1H, 15N-HSQC spectrum of UBE2W-WT (black) overlayed with the 1H, 15N-HSQC spectrum of UBE2W-KK (red). b Region of 1H, 15N-HSQC spectrum showing representative resonances shifted between UBE2W-WT (black) and UBE2W-KK (red) (i.e., L25, D40, L55, and L56) and new resonances in the UBE2W-KK spectrum (i.e., F60)