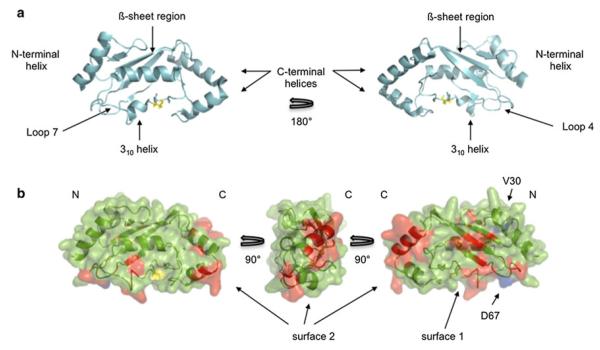
Fig. 5.
a Domain architecture and nomenclature of an E2 based on the structure of UBE2D3, the active site C85 is colored in yellow (PDB: 2FUH). b Observed NMR perturbations identify two surfaces on UBE2W. UBE2W homology model based on the structure of UBE2D3 (4DDG) is shown. Positions V30 and D67 (mutated to lysine in the ‘KK’ mutant background) are colored in blue, while red represents both significantly shifted (top 10 % of shifted resonances) resonances between WT and ‘KK’ spectra and new peaks that appear in the ‘KK’ spectrum. Surface 1 includes Loops 4 and 7, the ß-sheet region, and the 310 helix. Surface 2 is comprised entirely of the C-terminal region. The active site cysteine (C91) is colored yellow. For perturbed residues, only those resonances with unambiguous assignments are colored red

