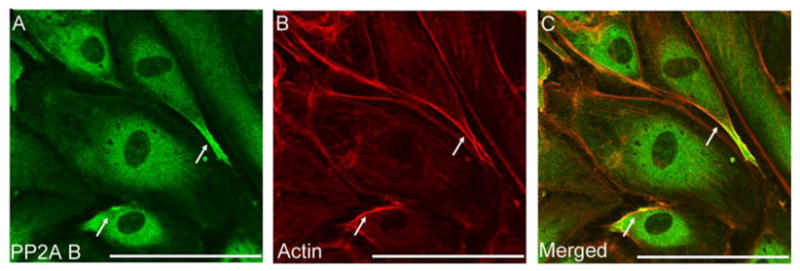
Figure 2. Subcellular localization of regulatory B subunit.

Immunofluorescent staining of BPAEC monolayer was performed using rabbit polyclonal antibody against PP2A B (A). To visualize F-actin Texas Red-phalloidin (B) was applied. Pictures were taken with an Olympus Fluoview FV1000 confocal microscope, scale bars: 200 μm. A and B are parallel images of double-stained cells, panel C is the merged image of A and B. Shown are representative data of three independent experiments.
