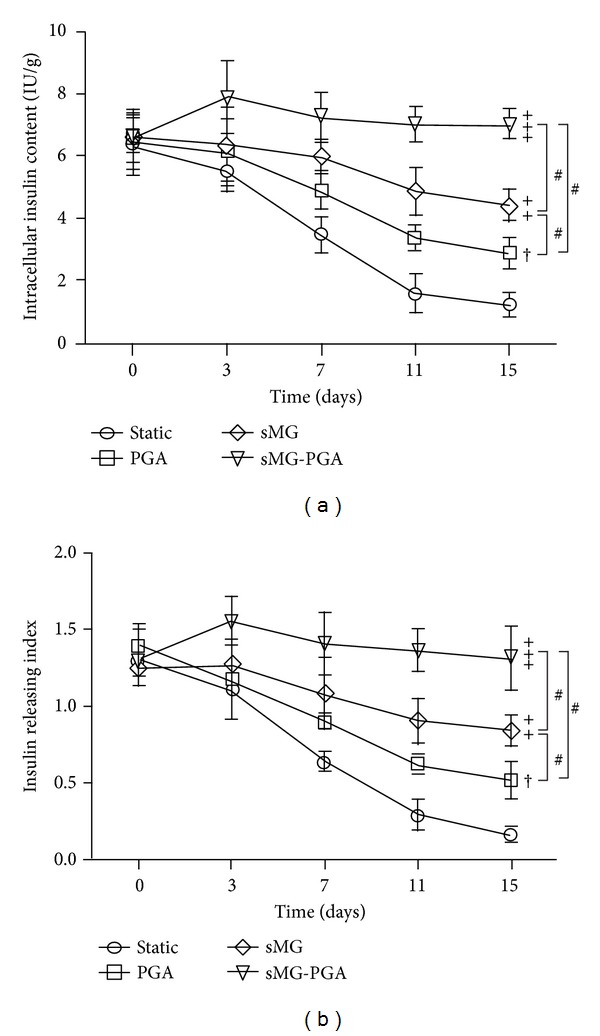
Figure 3.

Assessment of the insulin production. The intracellular insulin content (a) and insulin-releasing index (b) were calculated to determine the functionality of insulin production. Significant increases are indicated by “†” at P < 0.05, “++” at P < 0.01, and “+++” at P < 0.001, compared with the static group. Significant differences between PGA and sMG and between PGA-sMG and PGA or sMG are denoted by “#.”
