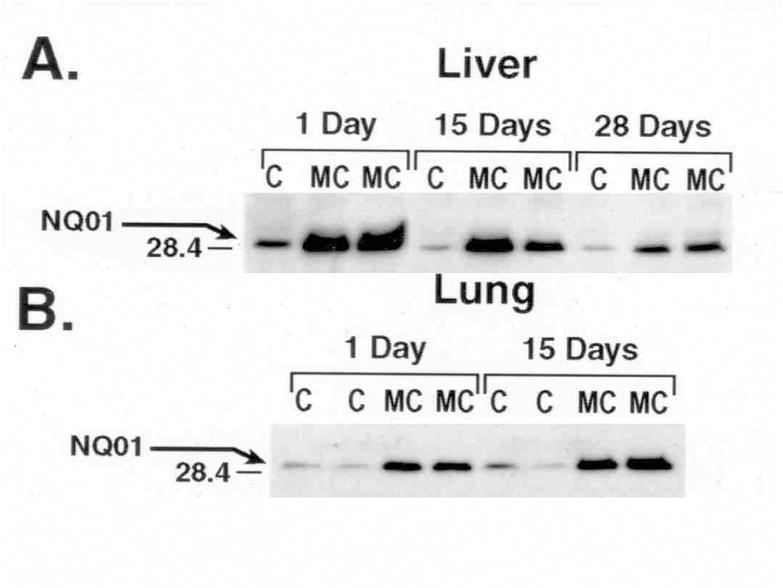
Figure 2.

Effect of MC on hepatic and pulmonary NQO1 protein expression. Rats were treated with MC or CO vehicle alone as control as described in Materials and Methods, and NQO1 apoprotein expression in liver (A) and lung (B) cytosols was determined at the indicated time points by Western blotting. Cytosolic fractions from at least 4 individual animals from each group were analyzed, and similar changes were noted. The figure is a representative blot showing the changes elicited by MC in two individual animals at each time point.
